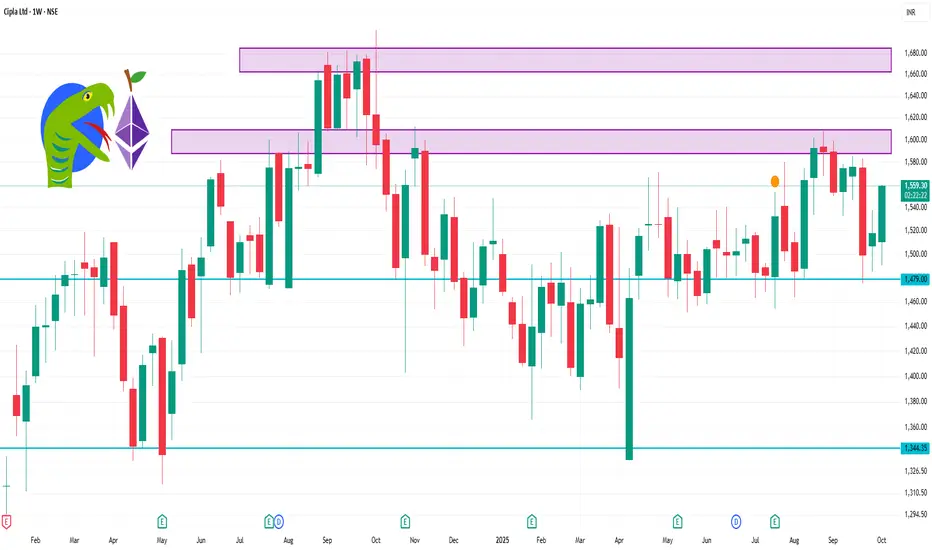
📈 Weekly Support & Resistance Levels
Support Levels:
S1: ₹1,491.53
S2: ₹1,499.17
S3: ₹1,506.48
S4: ₹1,514.12
Resistance Levels:
R1: ₹1,521.43
R2: ₹1,529.07
R3: ₹1,536.38
R4: ₹1,544.70
These levels are derived from the classic pivot point method and can serve as potential entry or exit points for traders.
Technical Indicators Snapshot
Relative Strength Index (RSI): 77.43 (approaching overbought territory)
MACD: 7.01 (bullish crossover)
Average Directional Index (ADX): 30.49 (indicating a strong trend)
Commodity Channel Index (CCI): 307.2 (overbought)
Williams %R: -0.79 (overbought)
Rate of Change (ROC): 3.81% (bullish momentum)
Moving Averages:
5-day: ₹1,527.76
50-day: ₹1,510.91
200-day: ₹1,542.76
פרסומים קשורים
כתב ויתור
המידע והפרסומים אינם אמורים להיות, ואינם מהווים, עצות פיננסיות, השקעות, מסחר או סוגים אחרים של עצות או המלצות שסופקו או מאושרים על ידי TradingView. קרא עוד בתנאים וההגבלות.
פרסומים קשורים
כתב ויתור
המידע והפרסומים אינם אמורים להיות, ואינם מהווים, עצות פיננסיות, השקעות, מסחר או סוגים אחרים של עצות או המלצות שסופקו או מאושרים על ידי TradingView. קרא עוד בתנאים וההגבלות.