Introduction
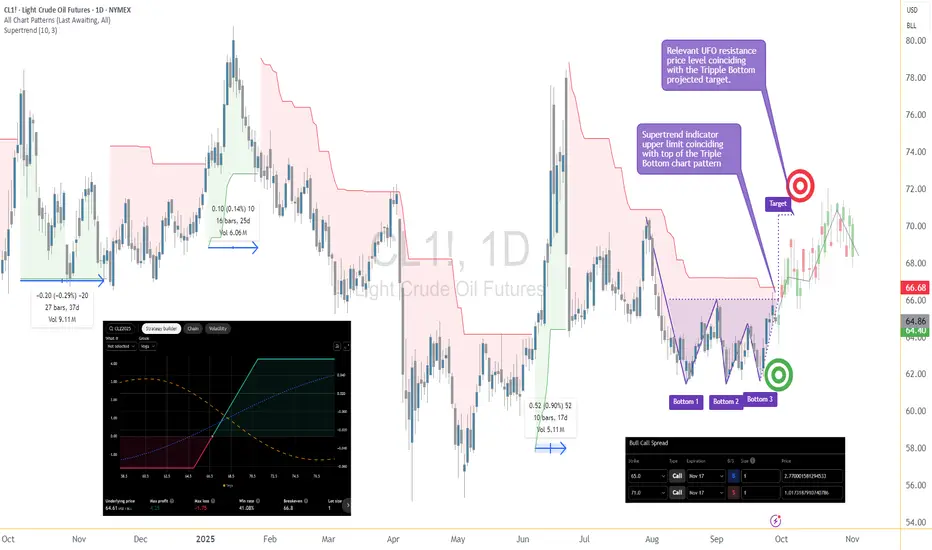
Crude Oil has been carving out a compelling structure on the daily timeframe. The chart has formed a Triple Bottom pattern, a classic base-building formation that often precedes significant directional moves. As prices approach a critical resistance area, traders are watching closely for confirmation of a breakout.
Options provide a unique way to participate in such setups. Instead of buying futures outright — which exposes the trader to potentially unlimited downside — a Bull Call Spread allows participation with limited and predefined risk. Today, we’ll explore how this strategy can be structured on WTI Crude Oil (CL) Options on Futures to target a move higher while keeping risk controlled.
Market Setup
This confluence of technical signals makes 66.68 a price level worth paying attention to.
The Strategy: Bull Call Spread
A Bull Call Spread involves buying one call option with a lower strike and simultaneously selling another call option with a higher strike, both with the same expiration.
Since each CL options contract represents 1,000 barrels of oil, the cost of this spread is about $1,750 per spread (subject to commissions).
Why November 17?
The timing matches the behavior of prior Supertrend cycles. The longest green cycle shown on the chart lasted about 37 trading days. By selecting Nov-17 expiration, the position allows sufficient time for a breakout and follow-through, while not overpaying for excess time value.
Risk/Reward Profile
From the risk graph:
The breakeven location is important: it aligns almost exactly with the breakout trigger on the chart. This means that if the technical pattern validates, the option structure begins to work immediately.
The reward-to-risk ratio above reflects the pricing available at the time of building the spread. If a trader waits for confirmation of the breakout before entering, option premiums may rise, making the Bull Call Spread slightly more expensive. In that case, the risk-to-reward ratio would be somewhat less favorable, though the trade-off is higher confirmation of the technical signal.
Trade Application
Here, the options spread itself already caps the maximum loss at $1,750 per spread. Still, traders may choose to exit earlier if the chart setup fails, avoiding full risk.
The defined-risk nature of the spread helps enforce discipline, as the worst-case scenario is known from the outset.
Contract Specs & Margin Considerations
WTI Crude Oil contracts at CME come in two main forms:
Both contracts offer powerful ways to trade Crude Oil, and traders also have access to options on the Micro CL contract. This means the same Bull Call Spread structure can be applied with much smaller capital outlay. Instead of ~$1,750 risk per spread with the standard CL options, the risk would be about $175 per spread using MCL options.
The availability of Micro contracts and options provides traders with greater flexibility to tailor exposure to account size and risk tolerance, while still benefiting from the same strategic advantages.
Margin requirements vary depending on the broker and clearing firm, but options spreads like this one are far more capital-efficient compared to holding outright futures. The premium paid becomes the required margin ($1,750 or $175 in this case) as it defines the total risk, without margin calls tied to daily fluctuations.
Risk Management
The hallmark of this Bull Call Spread is defined risk. Unlike a naked long call, where premium decay can erode value quickly, the short 71 Call helps reduce the upfront cost and lowers time decay exposure.
Key considerations:
Risk management is not just about setting stops; it’s also about designing positions where the worst-case scenario is tolerable before the trade is entered. This Bull Call Spread embodies that principle.
Conclusion
The WTI Crude Oil market is at a pivotal point. With a Triple Bottom base, a breakout above 66.68 could carry prices toward the 70.63 region, where unfilled orders and technical projections converge.
A Bull Call Spread on the Nov-17 expiration offers a structured way to engage with this potential move. It balances opportunity with defined risk, aligning the technical chart setup with the capital efficiency of options on futures.
As always, this is an educational case study designed to highlight how options can be used to structure trades around market scenarios.
When charting futures, the data provided could be delayed. Traders working with the ticker symbols discussed in this idea may prefer to use CME Group real-time data plan on TradingView: tradingview.com/cme/ - This consideration is particularly important for shorter-term traders, whereas it may be less critical for those focused on longer-term trading strategies.
General Disclaimer:
The trade ideas presented herein are solely for illustrative purposes forming a part of a case study intended to demonstrate key principles in risk management within the context of the specific market scenarios discussed. These ideas are not to be interpreted as investment recommendations or financial advice. They do not endorse or promote any specific trading strategies, financial products, or services. The information provided is based on data believed to be reliable; however, its accuracy or completeness cannot be guaranteed. Trading in financial markets involves risks, including the potential loss of principal. Each individual should conduct their own research and consult with professional financial advisors before making any investment decisions. The author or publisher of this content bears no responsibility for any actions taken based on the information provided or for any resultant financial or other losses.
Crude Oil has been carving out a compelling structure on the daily timeframe. The chart has formed a Triple Bottom pattern, a classic base-building formation that often precedes significant directional moves. As prices approach a critical resistance area, traders are watching closely for confirmation of a breakout.
Options provide a unique way to participate in such setups. Instead of buying futures outright — which exposes the trader to potentially unlimited downside — a Bull Call Spread allows participation with limited and predefined risk. Today, we’ll explore how this strategy can be structured on WTI Crude Oil (CL) Options on Futures to target a move higher while keeping risk controlled.
Market Setup
- Chart pattern: Triple Bottom on the daily timeframe.
- Entry trigger: Breakout above 66.68, where the top line of the Triple Bottom coincides with the upper band of the Supertrend indicator.
- Target: ~70.63, which aligns with both the Triple Bottom projected objective and a relevant UFO (UnFilled Orders) resistance area.
- Trend context: A successful breakout here would not only complete the Triple Bottom pattern but also suggest a broader trend reversal on the daily chart.
This confluence of technical signals makes 66.68 a price level worth paying attention to.
The Strategy: Bull Call Spread
A Bull Call Spread involves buying one call option with a lower strike and simultaneously selling another call option with a higher strike, both with the same expiration.
- Buy: CL Nov-17 65 Call (cost ≈ 2.77)
- Sell: CL Nov-17 71 Call (credit ≈ 1.02)
- Net debit (cost): ≈ 1.75 points
Since each CL options contract represents 1,000 barrels of oil, the cost of this spread is about $1,750 per spread (subject to commissions).
Why November 17?
The timing matches the behavior of prior Supertrend cycles. The longest green cycle shown on the chart lasted about 37 trading days. By selecting Nov-17 expiration, the position allows sufficient time for a breakout and follow-through, while not overpaying for excess time value.
Risk/Reward Profile
From the risk graph:
- Maximum Profit: ≈ 4.25 points, or $4,250 per spread.
- Maximum Loss: ≈ 1.75 points, or $1,750 per spread.
- Reward-to-Risk Ratio: ~2.4:1.
- Breakeven: ~66.8 (very close to breakout level).
The breakeven location is important: it aligns almost exactly with the breakout trigger on the chart. This means that if the technical pattern validates, the option structure begins to work immediately.
The reward-to-risk ratio above reflects the pricing available at the time of building the spread. If a trader waits for confirmation of the breakout before entering, option premiums may rise, making the Bull Call Spread slightly more expensive. In that case, the risk-to-reward ratio would be somewhat less favorable, though the trade-off is higher confirmation of the technical signal.
Trade Application
- Entry trigger: Now, or confirmed breakout above 66.68 depending on trader style.
- Target: ~70.63, aligning with the Triple Bottom projection and UFO resistance.
- Stop-loss consideration: If prices fall back below the Triple Bottom lows, the breakout thesis would be invalidated.
Here, the options spread itself already caps the maximum loss at $1,750 per spread. Still, traders may choose to exit earlier if the chart setup fails, avoiding full risk.
The defined-risk nature of the spread helps enforce discipline, as the worst-case scenario is known from the outset.
Contract Specs & Margin Considerations
WTI Crude Oil contracts at CME come in two main forms:
- Standard CL Contract: Represents 1,000 barrels of crude oil. A single point move = $1,000 P&L impact.
- Micro CL Contract (MCL): Represents 100 barrels of crude oil. A single point move = $100 P&L impact.
Both contracts offer powerful ways to trade Crude Oil, and traders also have access to options on the Micro CL contract. This means the same Bull Call Spread structure can be applied with much smaller capital outlay. Instead of ~$1,750 risk per spread with the standard CL options, the risk would be about $175 per spread using MCL options.
The availability of Micro contracts and options provides traders with greater flexibility to tailor exposure to account size and risk tolerance, while still benefiting from the same strategic advantages.
Margin requirements vary depending on the broker and clearing firm, but options spreads like this one are far more capital-efficient compared to holding outright futures. The premium paid becomes the required margin ($1,750 or $175 in this case) as it defines the total risk, without margin calls tied to daily fluctuations.
Risk Management
The hallmark of this Bull Call Spread is defined risk. Unlike a naked long call, where premium decay can erode value quickly, the short 71 Call helps reduce the upfront cost and lowers time decay exposure.
Key considerations:
- Position sizing: Limit risk per trade to a fraction of total trading capital.
- Time decay management: If the move happens quickly, consider taking profits early instead of holding until expiration.
- Adjustment potential: If CL approaches 70 quickly, traders may roll the short call higher to extend potential gains.
Risk management is not just about setting stops; it’s also about designing positions where the worst-case scenario is tolerable before the trade is entered. This Bull Call Spread embodies that principle.
Conclusion
The WTI Crude Oil market is at a pivotal point. With a Triple Bottom base, a breakout above 66.68 could carry prices toward the 70.63 region, where unfilled orders and technical projections converge.
A Bull Call Spread on the Nov-17 expiration offers a structured way to engage with this potential move. It balances opportunity with defined risk, aligning the technical chart setup with the capital efficiency of options on futures.
As always, this is an educational case study designed to highlight how options can be used to structure trades around market scenarios.
When charting futures, the data provided could be delayed. Traders working with the ticker symbols discussed in this idea may prefer to use CME Group real-time data plan on TradingView: tradingview.com/cme/ - This consideration is particularly important for shorter-term traders, whereas it may be less critical for those focused on longer-term trading strategies.
General Disclaimer:
The trade ideas presented herein are solely for illustrative purposes forming a part of a case study intended to demonstrate key principles in risk management within the context of the specific market scenarios discussed. These ideas are not to be interpreted as investment recommendations or financial advice. They do not endorse or promote any specific trading strategies, financial products, or services. The information provided is based on data believed to be reliable; however, its accuracy or completeness cannot be guaranteed. Trading in financial markets involves risks, including the potential loss of principal. Each individual should conduct their own research and consult with professional financial advisors before making any investment decisions. The author or publisher of this content bears no responsibility for any actions taken based on the information provided or for any resultant financial or other losses.
🌟 Take This Analysis Further with Our AI Scripts 🎯 | Discover How at tradewithufos.com 🚀 Choose a Subscription: Monthly ᴼᴿ Yearly ᴼᴿ Lifetime 🗓️ | Unlock Intelligent UFO Scripts Free 💡
פרסומים קשורים
כתב ויתור
המידע והפרסומים אינם אמורים להיות, ואינם מהווים, עצות פיננסיות, השקעות, מסחר או סוגים אחרים של עצות או המלצות שסופקו או מאושרים על ידי TradingView. קרא עוד בתנאים וההגבלות.