📊 Pattern & Explanation
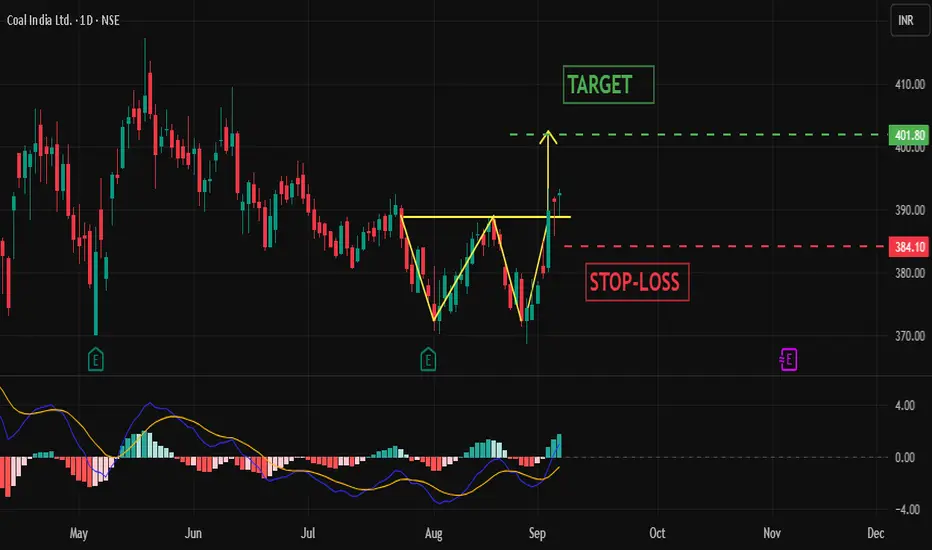
COALINDIA has formed a double bottom pattern, which looks like a “W” on the chart. This occurs when price tests the same support level twice and holds strongly. It signals that buyers are defending that zone. Once the neckline (resistance above the bottoms) is crossed with momentum, it often leads to a strong upward move.
📈 Key Levels
Target: 402 – calculated from the breakout projection.
Stoploss: 384 – to limit downside risk.
📊 MACD Crossover
The MACD (Moving Average Convergence Divergence) is a momentum indicator. A positive crossover happens when the MACD line moves above the signal line, showing fresh buying strength and supporting the bullish breakout setup in COALINDIA.
💡 Why This Setup Matters
This setup combines price action (double bottom breakout) with momentum confirmation (positive MACD crossover). When support holds twice and momentum shifts upward, the chances of a sustained rally improve. Traders can use this confluence to trade with higher confidence, while managing risk with a clear target and stoploss.
העסקה בוטלה באופן ידני
Price has reversed from few points away of the target price hence need to be closed manuallyMy Social Media links :
📥 Instagram - instagram.com/sagar_trademaster/
📥 Youtube - youtube.com/@TruthfulTrader
📥 Instagram - instagram.com/sagar_trademaster/
📥 Youtube - youtube.com/@TruthfulTrader
כתב ויתור
המידע והפרסומים אינם אמורים להיות, ואינם מהווים, עצות פיננסיות, השקעות, מסחר או סוגים אחרים של עצות או המלצות שסופקו או מאושרים על ידי TradingView. קרא עוד בתנאים וההגבלות.
My Social Media links :
📥 Instagram - instagram.com/sagar_trademaster/
📥 Youtube - youtube.com/@TruthfulTrader
📥 Instagram - instagram.com/sagar_trademaster/
📥 Youtube - youtube.com/@TruthfulTrader
כתב ויתור
המידע והפרסומים אינם אמורים להיות, ואינם מהווים, עצות פיננסיות, השקעות, מסחר או סוגים אחרים של עצות או המלצות שסופקו או מאושרים על ידי TradingView. קרא עוד בתנאים וההגבלות.