Hello?
Dear traders, nice to meet you.
"Like" is a huge force for me.
By "following" you can always get new information quickly.
Thank you for always supporting me.
-------------------------------------------------- -----
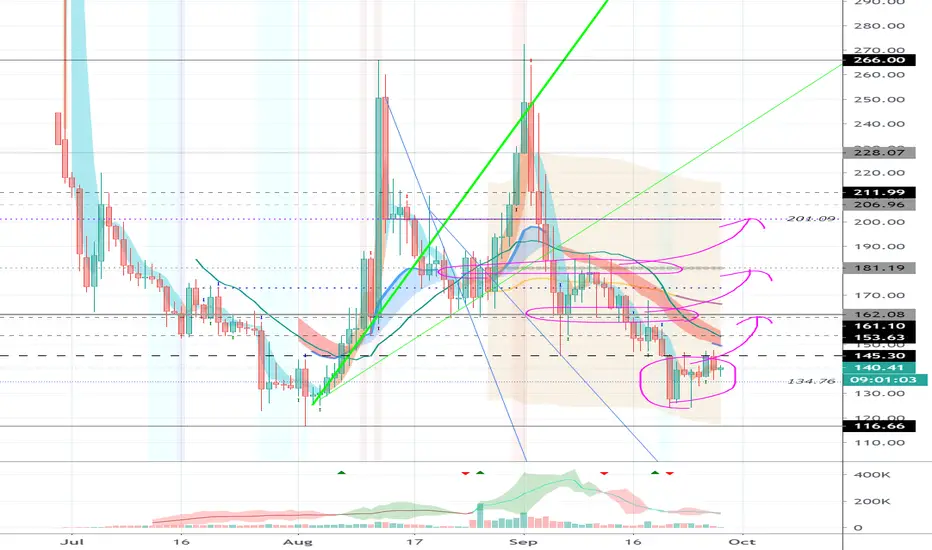
It remains to be seen if it can rise above the 145.30 point to form a double bottom.
We should also see if we get support at 145.30 and climb, allowing for a cascading climb as shown in the chart.
The important point in our current location is at 162.08.
If you climb above the 162.08 point and get support, I think it is possible that the bottom section has been formed.
-------------------------------------------------- -------------------------------------------
I think it is a period of volatility from September 21st to October 1st.
Therefore, I think careful trading is necessary.
About October 28, when maximum volatility is expected to occur, is about a month left.
The most important thing is to generate revenue, so I think it's time to trade to earn money.
** Check support, resistance, and abbreviation points.
** Support or resistance is based on the closing price of the 1D chart.
** All explanations are for reference only and do not guarantee profit or loss on investment.
Explanation of abbreviations displayed on the chart
R: A point or section of resistance that requires a response to preserve profits
S-L: Stop-Loss point or section
S: A point or segment that can be bought for profit generation as a support point or segment
(Short-term Stop Loss can be said to be a point where profits and losses can be preserved or additionally entered through installment trading. You should trade from a short-term investment perspective.)
Dear traders, nice to meet you.
"Like" is a huge force for me.
By "following" you can always get new information quickly.
Thank you for always supporting me.
-------------------------------------------------- -----
It remains to be seen if it can rise above the 145.30 point to form a double bottom.
We should also see if we get support at 145.30 and climb, allowing for a cascading climb as shown in the chart.
The important point in our current location is at 162.08.
If you climb above the 162.08 point and get support, I think it is possible that the bottom section has been formed.
-------------------------------------------------- -------------------------------------------
I think it is a period of volatility from September 21st to October 1st.
Therefore, I think careful trading is necessary.
About October 28, when maximum volatility is expected to occur, is about a month left.
The most important thing is to generate revenue, so I think it's time to trade to earn money.
** Check support, resistance, and abbreviation points.
** Support or resistance is based on the closing price of the 1D chart.
** All explanations are for reference only and do not guarantee profit or loss on investment.
Explanation of abbreviations displayed on the chart
R: A point or section of resistance that requires a response to preserve profits
S-L: Stop-Loss point or section
S: A point or segment that can be bought for profit generation as a support point or segment
(Short-term Stop Loss can be said to be a point where profits and losses can be preserved or additionally entered through installment trading. You should trade from a short-term investment perspective.)
※ Follow X to check out the posts.
※ X를 팔로우하고 게시물을 확인하세요.
◆ t.me/readCryptoChannel
[HA-MS Indicator]
bit.ly/3YxHgvN
[OBV Indicator]
bit.ly/4dcyny3
※ X를 팔로우하고 게시물을 확인하세요.
◆ t.me/readCryptoChannel
[HA-MS Indicator]
bit.ly/3YxHgvN
[OBV Indicator]
bit.ly/4dcyny3
פרסומים קשורים
כתב ויתור
המידע והפרסומים אינם מיועדים להיות, ואינם מהווים, ייעוץ או המלצה פיננסית, השקעתית, מסחרית או מכל סוג אחר המסופקת או מאושרת על ידי TradingView. קרא עוד ב־תנאי השימוש.