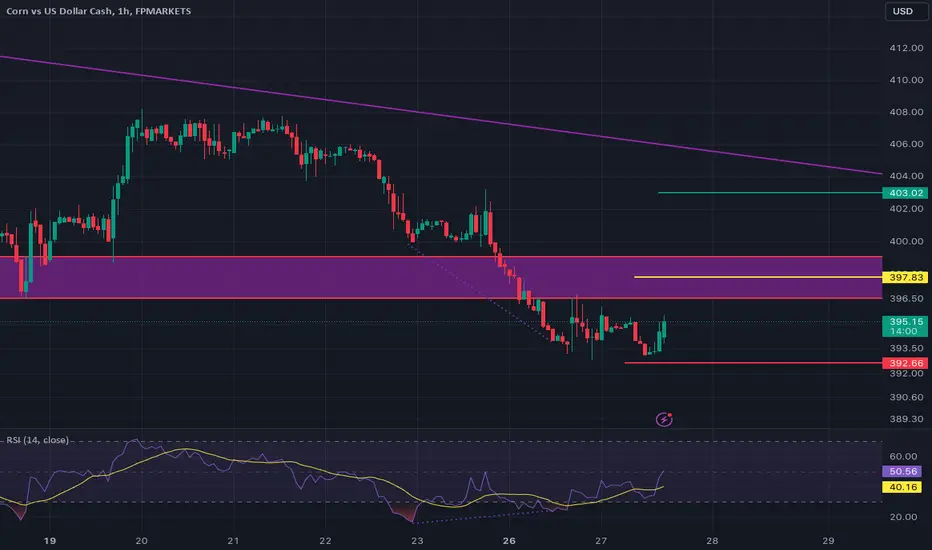
Corn analysis is done on an hourly chart. There is a bullish divergence on an hourly chart with a formation of double bottom reversal pattern. Placed an entry on the previous LH with SL placed just below the double bottom.
The Signal is:
EP: 397.83
SL: 392.66
TP: 403.00
The Signal is:
EP: 397.83
SL: 392.66
TP: 403.00
כתב ויתור
המידע והפרסומים אינם אמורים להיות, ואינם מהווים, עצות פיננסיות, השקעות, מסחר או סוגים אחרים של עצות או המלצות שסופקו או מאושרים על ידי TradingView. קרא עוד בתנאים וההגבלות.
כתב ויתור
המידע והפרסומים אינם אמורים להיות, ואינם מהווים, עצות פיננסיות, השקעות, מסחר או סוגים אחרים של עצות או המלצות שסופקו או מאושרים על ידי TradingView. קרא עוד בתנאים וההגבלות.