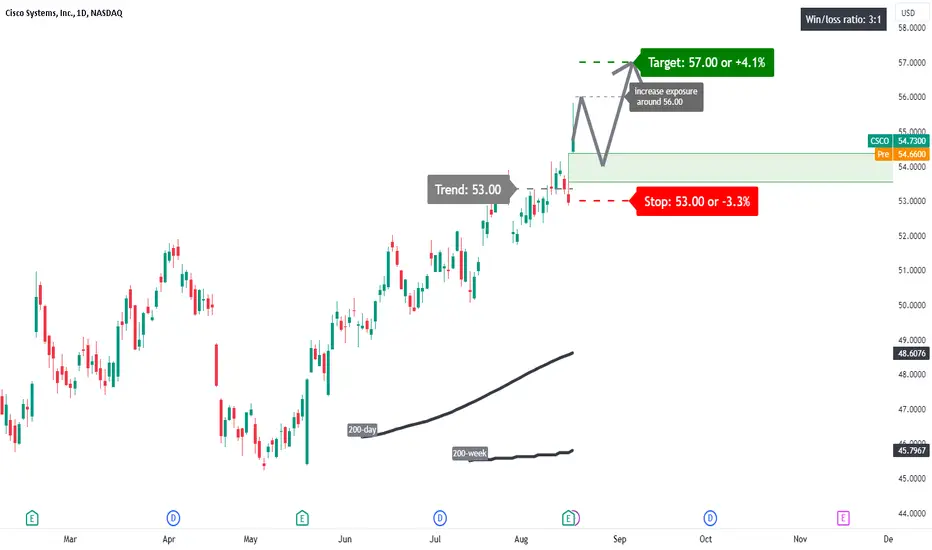
Is this a breakaway gap: These gaps occur at the end of a price pattern and signify the beginning of a new trend. It is challenging to trade these as they can indicate strong momentum.
A price action above 53.00 supports a bullish trend direction.
Further bullish confirmation for a break above 56.00.
The target price is set at 57.00.
The stop-loss price is set at 53.00 as well.
The stock is already overbought and one might need to wait for a pullback before entering into a position.
כתב ויתור
המידע והפרסומים אינם אמורים להיות, ואינם מהווים, עצות פיננסיות, השקעות, מסחר או סוגים אחרים של עצות או המלצות שסופקו או מאושרים על ידי TradingView. קרא עוד בתנאים וההגבלות.
כתב ויתור
המידע והפרסומים אינם אמורים להיות, ואינם מהווים, עצות פיננסיות, השקעות, מסחר או סוגים אחרים של עצות או המלצות שסופקו או מאושרים על ידי TradingView. קרא עוד בתנאים וההגבלות.
