Wave Structure Overview – Elliott Cycle Breakdown
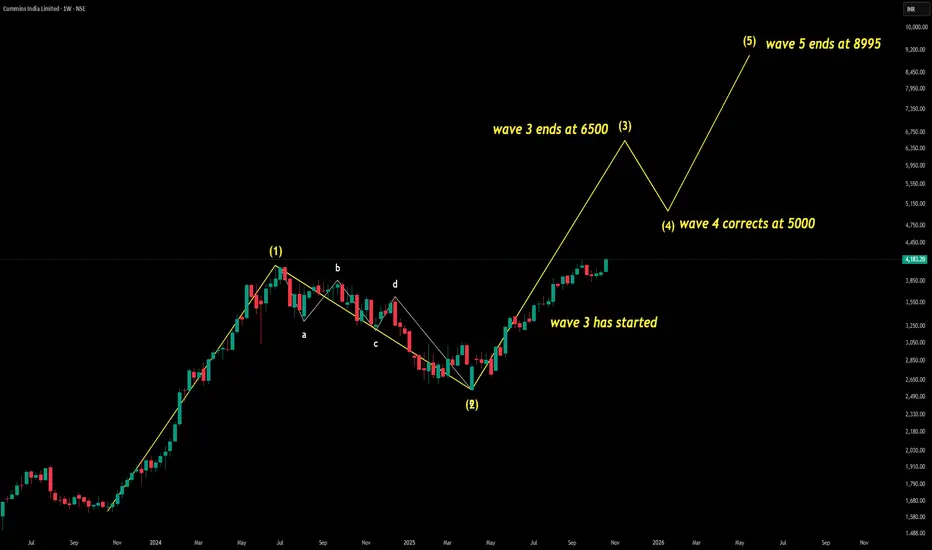
This chart captures a full Elliott Wave impulse cycle (1–5) followed by the anticipated corrective phase (a–b–c). It reflects market psychology in motion—from early optimism to trend exhaustion.
Wave Summary:
Wave (1): Initial breakout – trend confirmation begins
Wave (2): Shallow pullback – bullish continuation
Wave (3): Ends at 6500 – strongest wave, broad participation
Wave (4): Corrects to 5000 – healthy retracement, sets up final push
Wave (5): Ends at 8995 – final rally, possible exhaustion or divergence
Wave a–b–c: Expected next – corrective structure likely
Technical Insights
Wave 3 shows classic acceleration – ideal for breakout teaching
Wave 4 respects Fibonacci zones – great for entry logic
Wave 5 overshoots – likely divergence, ideal for reversal training
Strategic Takeaways – For Traders & Students
Impulse cycle (1–5) is complete
Wave 5 has peaked at 8995 – trend exhaustion likely
What’s Next Prepare for a–b–c corrective structure
Watch for: RSI divergence
Volume drop
Fibonacci retracement zones (38.2%–61.8%)
“Wave 5 has completed at 8995. Expect a corrective a–b–c structure. Avoid fresh longs. Ideal time to teach reversal setups, divergence spotting, and Fibonacci retracement logic.”
Sucrit.D.Patil
כתב ויתור
המידע והפרסומים אינם מיועדים להיות, ואינם מהווים, ייעוץ או המלצה פיננסית, השקעתית, מסחרית או מכל סוג אחר המסופקת או מאושרת על ידי TradingView. קרא עוד ב־תנאי השימוש.
Sucrit.D.Patil
כתב ויתור
המידע והפרסומים אינם מיועדים להיות, ואינם מהווים, ייעוץ או המלצה פיננסית, השקעתית, מסחרית או מכל סוג אחר המסופקת או מאושרת על ידי TradingView. קרא עוד ב־תנאי השימוש.