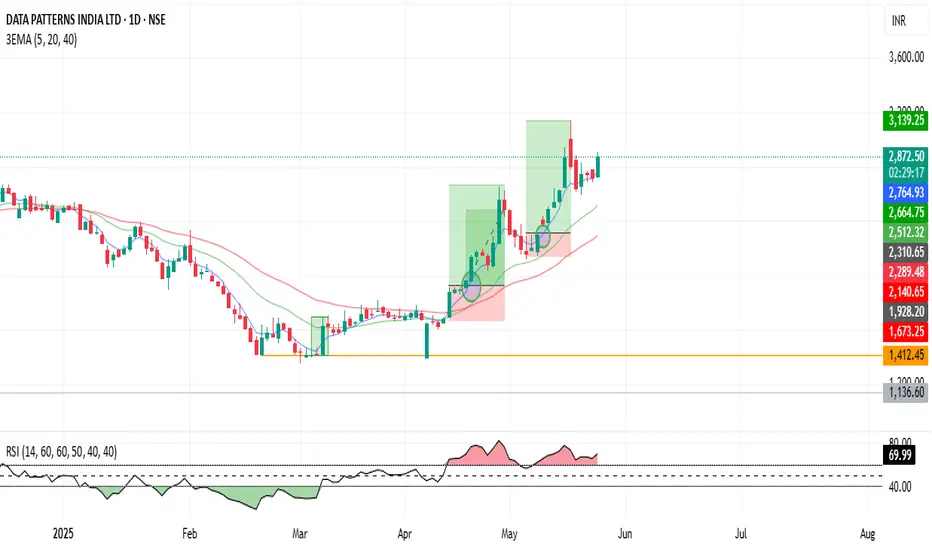
When a 20-day Exponential Moving Average (EMA) crosses above a 40-day EMA, it is generally considered a bullish signal, suggesting a potential uptrend in the asset's price. This "Golden Cross" can indicate that short-term momentum is outperforming long-term trends, potentially leading to further price increases.
But after that when candle cross above 5 EMA just take your buy position. Hold for next 5 days or wait for next one big candle with in 5-6 days & then after one red candle which completely without touch 5EMA. that day exit our swing position.
(The 5 EMA trading strategy involves using the 5-day Exponential Moving Average (EMA) to identify potential entry and exit points for trades. It's a popular strategy)
כתב ויתור
המידע והפרסומים אינם מיועדים להיות, ואינם מהווים, ייעוץ או המלצה פיננסית, השקעתית, מסחרית או מכל סוג אחר המסופקת או מאושרת על ידי TradingView. קרא עוד ב־תנאי השימוש.
כתב ויתור
המידע והפרסומים אינם מיועדים להיות, ואינם מהווים, ייעוץ או המלצה פיננסית, השקעתית, מסחרית או מכל סוג אחר המסופקת או מאושרת על ידי TradingView. קרא עוד ב־תנאי השימוש.