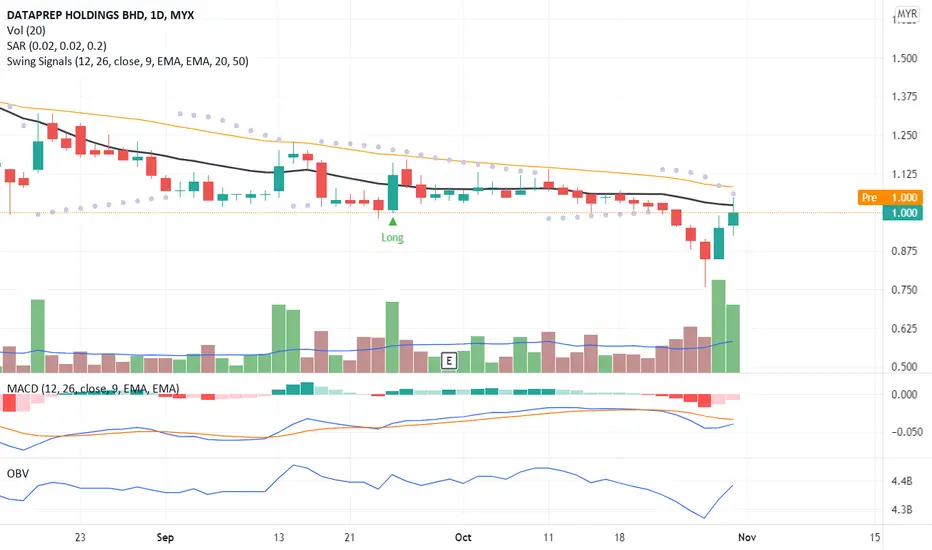
The candlestick indicates a possibility of a divergence signal to become an uptrend pattern. Fibonacci Retracement also confirmed the divergence signal. OBV chart indicates a positive uptrend. MACD chart is still in the weakness signal probability of a divergence. The weekly timeframe is still negative and not suitable for a long trade position. Put DATAPRP in your WL and watch out for price movement above MA20 and the candlestick closed above MA20.
R 1.090
S 0.940
R 1.090
S 0.940
כתב ויתור
המידע והפרסומים אינם מיועדים להיות, ואינם מהווים, ייעוץ או המלצה פיננסית, השקעתית, מסחרית או מכל סוג אחר המסופקת או מאושרת על ידי TradingView. קרא עוד ב־תנאי השימוש.
כתב ויתור
המידע והפרסומים אינם מיועדים להיות, ואינם מהווים, ייעוץ או המלצה פיננסית, השקעתית, מסחרית או מכל סוג אחר המסופקת או מאושרת על ידי TradingView. קרא עוד ב־תנאי השימוש.