Maybe its is 'parabonoma'
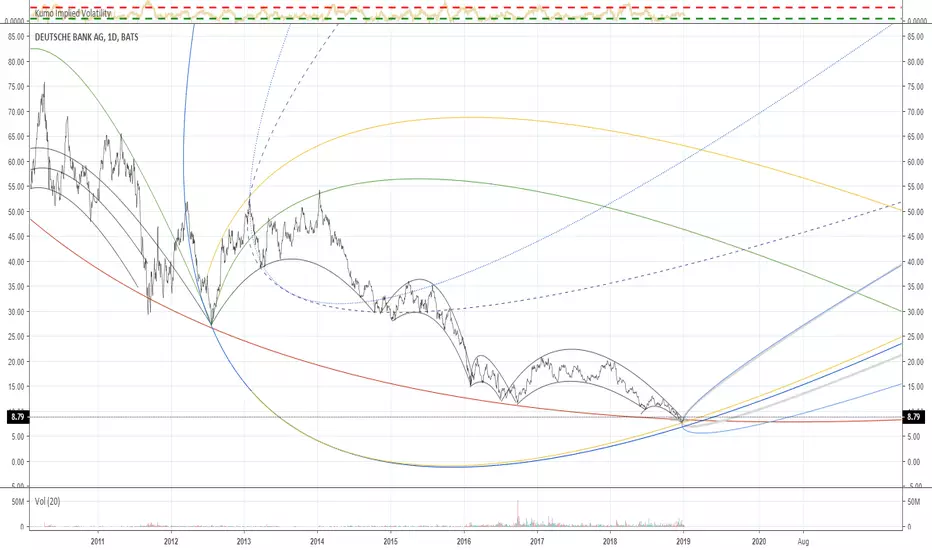
21 March 2012, to 24 July 2012
this maps to the present moment.
that is the corridor in Solid Blue/yellow dividing bilaterally the parabolas engendered by the break out of life. Will it survive. . . Cliff hanger
Is this phenomena, math? Weird chaos ripples?
21 March 2012, to 24 July 2012
this maps to the present moment.
that is the corridor in Solid Blue/yellow dividing bilaterally the parabolas engendered by the break out of life. Will it survive. . . Cliff hanger
Is this phenomena, math? Weird chaos ripples?
הערה
The curves are focused when the Blue and Yellow are focused. These are the same line. If They appear close, that is where in the pan the other parabolas are accurate.הערה
This chart, in review, is the prescient one./פרסומים קשורים
כתב ויתור
המידע והפרסומים אינם אמורים להיות, ואינם מהווים, עצות פיננסיות, השקעות, מסחר או סוגים אחרים של עצות או המלצות שסופקו או מאושרים על ידי TradingView. קרא עוד בתנאים וההגבלות.
פרסומים קשורים
כתב ויתור
המידע והפרסומים אינם אמורים להיות, ואינם מהווים, עצות פיננסיות, השקעות, מסחר או סוגים אחרים של עצות או המלצות שסופקו או מאושרים על ידי TradingView. קרא עוד בתנאים וההגבלות.