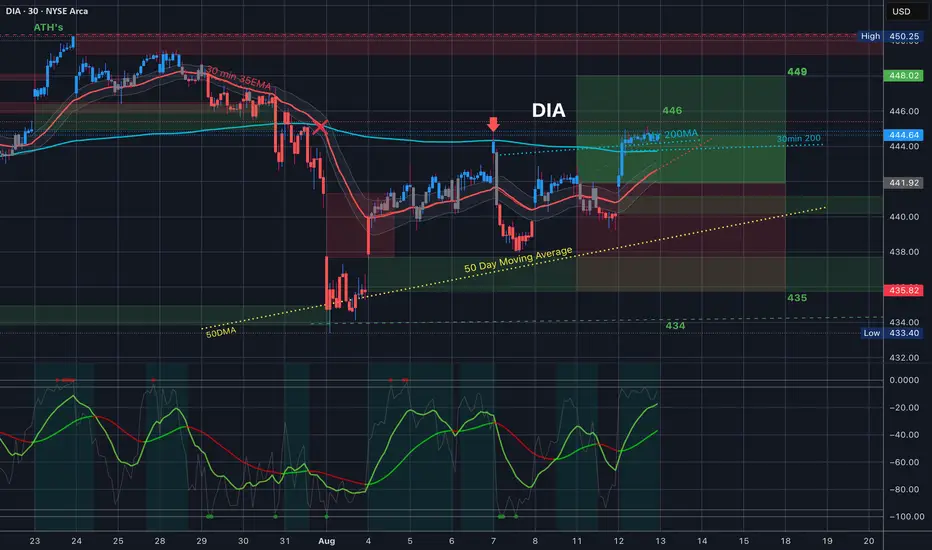
Alright, what a day. DIA, after a down day to start the week, gapped up above the 35EMA and then pushed above the 30min & 1hr 200MA’s which you can see were trading together and traded sideways from there near previous resistance. Still well within the trading range for the week.
(HIT GRAB THIS CHART - UNDER THE CHART NEXT TO THE 🚀)
כתב ויתור
המידע והפרסומים אינם מיועדים להיות, ואינם מהווים, ייעוץ או המלצה פיננסית, השקעתית, מסחרית או מכל סוג אחר המסופקת או מאושרת על ידי TradingView. קרא עוד ב־תנאי השימוש.
כתב ויתור
המידע והפרסומים אינם מיועדים להיות, ואינם מהווים, ייעוץ או המלצה פיננסית, השקעתית, מסחרית או מכל סוג אחר המסופקת או מאושרת על ידי TradingView. קרא עוד ב־תנאי השימוש.