#Dixon Technologies (India) Ltd. - Technical Analysis Report
Current Price:15,697.00
Timeframe: Weekly Chart Analysis
Market Structure Overview
Dixon Technologies is currently trading at 15,697, showing signs of potential #bullish #momentum after a period of #consolidation. The #stock has been forming a significant base pattern following its decline from #all-time highs near 18,177.
#Key Technical Levels
#Support Zones
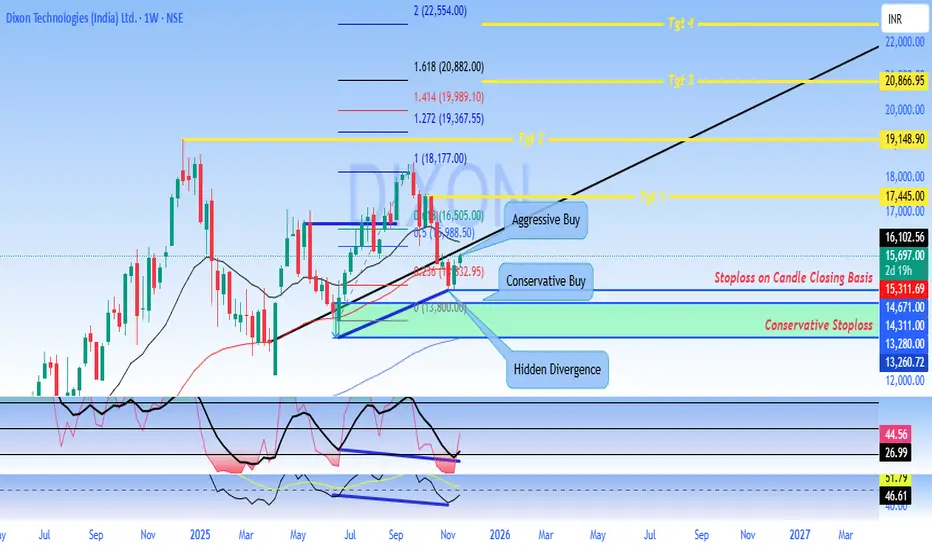
- Primary Support: 13,800 - 14,311 (Conservative Stoploss zone)
- Secondary Support: 13,260 - 13,280
- Critical Support: 12,000 (major psychological level)
#Resistance Zones
- Immediate Resistance: 16,102 - 16,505
- Key Resistance 1: 17,445 (Target 1)
- Key Resistance 2: 19,148 (Target 2)
- Major Resistance: 20,866 - 22,000 (Target 3 & 4 zone)
#Chart Pattern Analysis
The weekly chart reveals a **potential bullish reversal pattern** with the following characteristics:
1. Hidden Divergence: The chart shows hidden bullish divergence on momentum indicators, suggesting underlying strength despite recent price consolidation
2. Consolidation Box: A clear accumulation zone has formed between 13,800 and 16,500
3. Trend Channel: A rising trend channel indicates the potential for continued upward movement toward the 20,000+ zone
#Trading Strategies
#Aggressive Buy Setup
- Entry Zone: 16,505 - 16,102 (on breakout confirmation)
- Target Sequence: 17,445 → 19,148 → 20,866
- Stop Loss: Below 15,311 on candle closing basis
- Risk-Reward: Favorable 1:3+ ratio
#Conservative Buy Setup
- Entry Zone: 15,697 - 15,311 (current levels)
- Target Sequence: 17,445 → 19,148
- Stop Loss: Below 14,311 on candle closing basis (Conservative Stoploss)
- Risk-Reward: Approximately 1:2.5 ratio
#Momentum Indicators
The lower panel indicators suggest:
- Recovery from oversold conditions
- Building positive momentum
- Potential for sustained upward movement if key resistance levels are breached
#Fibonacci Levels
Key Fibonacci retracement/extension levels marked on the chart:
- 1.618 Extension: 20,882
- 1.414 Extension: 19,989
- 1.272 Extension: 19,367
- 1.000 Level: 18,177
#Outlook
Bullish Scenario: A sustained move above 16,505 with strong volume could trigger momentum toward 17,445 initially, with extended targets at 19,148 and potentially 20,866+. The stock appears to be in an accumulation phase with potential for a significant upside breakout.
Bearish Scenario: Failure to hold above 14,311 on a closing basis would invalidate the bullish setup and could lead to a retest of 13,260-13,280 support zone.
#Risk Management.
- Always use stop-loss orders on a candle closing basis - Position sizing should not exceed 2-3% of total portfolio value - Avoid overleveraging in options or futures - Monitor volume confirmation on breakout levels
DISCLAIMER
This analysis is for educational and informational purposes only and should NOT be considered as financial advice or a recommendation to buy or sell securities.
- Past performance is not indicative of future results - Trading and investing in stocks involves substantial risk of loss - All investment decisions should be made based on your own research, risk tolerance, and financial situation - Please consult with a SEBI-registered financial advisor before making any investment decisions - The author/analyst is not responsible for any profits or losses incurred based on this analysis - Technical analysis has limitations and should be combined with fundamental analysis - Market conditions can change rapidly, and all levels mentioned are subject to change
**Trade at your own risk. Always do your own due diligence.**
*Analysis created using TradingView charts | Not SEBI Registered Investment Advice*
פרסומים קשורים
כתב ויתור
המידע והפרסומים אינם מיועדים להיות, ואינם מהווים, ייעוץ או המלצה פיננסית, השקעתית, מסחרית או מכל סוג אחר המסופקת או מאושרת על ידי TradingView. קרא עוד ב־תנאי השימוש.
כתב ויתור
המידע והפרסומים אינם מיועדים להיות, ואינם מהווים, ייעוץ או המלצה פיננסית, השקעתית, מסחרית או מכל סוג אחר המסופקת או מאושרת על ידי TradingView. קרא עוד ב־תנאי השימוש.