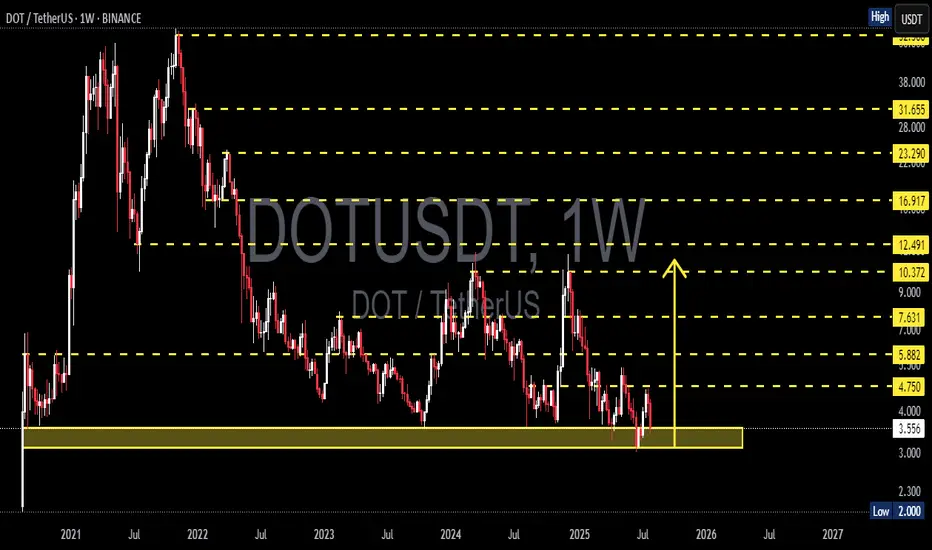
Polkadot (DOT) is once again retesting one of its strongest macro support zones between $4.00 – $3.55, a historically significant demand area that has provided major price bounces since mid-2022.
This isn’t just a random level—it’s a critical accumulation base where large buyers have consistently shown interest. With price now hovering around this zone again, the next move could be decisive for DOT's mid- to long-term trend.
---
🔍 Price Structure & Key Patterns
Extended Accumulation Phase: DOT has been trading in a sideways range for over 80 weeks, indicating a potential bottoming structure forming after a prolonged downtrend.
Strong Historical Demand: The $4.00 – $3.55 region has acted as a key support multiple times since 2022, reinforcing its importance as a make-or-break zone.
Potential Trap Setup: Current price action could be forming either a bull trap or bear trap, depending on whether price rebounds or breaks down. Weekly candle confirmation will be key.
---
🟢 Bullish Scenario (Upside Reversal)
If price holds and prints a strong bullish candle (e.g., bullish engulfing or long-tailed hammer), expect the following upside targets:
Short-term: $4.75 – $5.88
Mid-term: $7.63 – $9.00
Long-term: $10.37 – $12.49, aligning with prior distribution zones
✅ A breakout from this long accumulation base could trigger a massive short squeeze and renewed buying momentum.
---
🔴 Bearish Scenario (Breakdown)
If DOT closes below $3.55 on the weekly chart:
Confirms breakdown from macro support
Opens downside risk toward $2.30 – $2.00
Would print a new lower low, extending the bear market phase and potentially triggering capitulation
⚠️ Speculative long positions should include tight risk management below $3.50.
---
🧠 Market Sentiment & Strategy
DOT appears to be in a "Capitulation meets Hope" phase—selling pressure is exhausting, but bullish conviction hasn't yet taken control.
Ideal entry zones lie within the current demand range, with tight stops.
Watch for a daily breakout or bullish momentum confirmation next week before committing to positions.
---
📌 Final Takeaway
> DOT is standing at the edge of a cliff—or a launchpad. The $3.55–$4.00 zone has repeatedly been the foundation for rebounds. If history repeats, this may be the beginning of a new uptrend. If not—brace for deeper downside.
⏳ The market is watching. Will DOT break out… or break down?
#DOTUSDT #Polkadot #CryptoTechnicalAnalysis #SupportResistance #CryptoRebound #BearishOrBullish #AltcoinOutlook #CryptoBreakdown #WeeklyChart #AccumulationZone #DOTAnalysis
✅ Get Free Signals! Join Our Telegram Channel Here: t.me/TheCryptoNuclear
✅ Twitter: twitter.com/crypto_nuclear
✅ Join Bybit : partner.bybit.com/b/nuclearvip
✅ Benefits : Lifetime Trading Fee Discount -50%
✅ Twitter: twitter.com/crypto_nuclear
✅ Join Bybit : partner.bybit.com/b/nuclearvip
✅ Benefits : Lifetime Trading Fee Discount -50%
כתב ויתור
המידע והפרסומים אינם אמורים להיות, ואינם מהווים, עצות פיננסיות, השקעות, מסחר או סוגים אחרים של עצות או המלצות שסופקו או מאושרים על ידי TradingView. קרא עוד בתנאים וההגבלות.