📊 DRREDDY – Technical & Educational Snapshot
Ticker: NSE: DRREDDY | Sector: 💊 Pharma
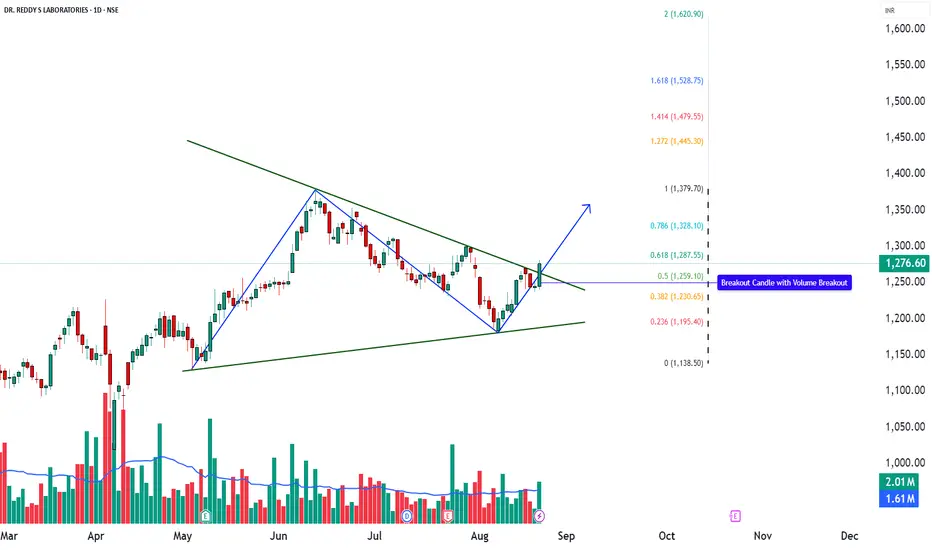
CMP: ₹1,276.60 ▲ (+2.51% | 22 Aug 2025)
Rating (for learning purpose): ⭐⭐⭐⭐ (Moderately Bullish)
Pattern Observed: 📈 Triangle Breakout with Volume Confirmation
📰 Sentiment Analysis
👉 Overall Sentiment: Positive ✅
• Bullish Drivers: Breakout from triangle formation, Morning Star on daily, bullish PinBar on monthly, strong Q1 results with revenue & profit growth, and renewed interest in pharma sector due to healthcare demand.
• Risks (Bearish Case): Any failure to sustain above ₹1,250 or renewed pressure from regulatory issues/patent challenges could trigger pullbacks.
• Short-term Outlook: Strong breakout with momentum, but some cooling-off likely due to Stochastic overbought levels.
• Long-term Outlook: Positive — consistent financial performance, strong pharma pipeline, and robust technical structure suggest higher upside potential.
📊 Technical Snapshot
DRREDDY has broken out from a triangle formation, supported by a Morning Star candlestick on the daily timeframe and a Bullish PinBar on the monthly chart — both strong reversal cues. A bullish Supertrend, RSI breakout, and Bollinger Band expansion signal renewed buying interest. Volume above the 20-SMA average further validates the breakout, suggesting institutional participation. While momentum is strong, Stochastic is near overbought, which means short-term pullbacks cannot be ruled out. However, as long as price sustains above key support zones, the broader trend bias remains upward.
📊 Volume Check
🔹 Current Volume: 2.01M
🔹 20 SMA Volume: 1.61M ✅
💥 Above-average participation → confirms breakout reliability with demand expansion.
💡 Interpretation: Higher-than-average volumes in breakout zones indicate broader market participation and improve the chances of trend continuation.
💡 Learnings
Breakouts from consolidation patterns like triangles tend to extend into trending moves when supported by momentum indicators (RSI + MACD). Elevated CCI levels indicate consistent buying pressure, but traders should remain alert to possible short pullbacks, especially when Stochastic enters the overbought zone. Defining a stop-loss and invalidation level is key for disciplined trade management.
📌 Key Levels
Resistance: 1292 | 1308 | 1334
Support: 1251 | 1225 | 1209
Fibonacci Levels: 1138.50 | 1195.40 | 1230.65 | 1259.10 | 1287.55 | 1328.10 | 1379.70
🎯 STWP Learning Reference
• Observed breakout zone: ~1281.8
• Key support level: ~1236
• Upside reference zones (if momentum continues): 1327 | 1372
• Pullback watch zone: 1224–1230 (where demand has earlier emerged)
• Invalidation reference: Below 1195 (trend may weaken)
⚠️ Disclaimer – Please Read Carefully
The information shared here is meant purely for learning and awareness. It is not a buy or sell recommendation and should not be taken as investment advice. I am not a SEBI-registered investment advisor, and all views expressed are based on personal study, chart patterns, and publicly available market data.
Trading — whether in stocks or options — carries risk. Markets can move unexpectedly, and losses can sometimes exceed the money you have invested. Past performance or past setups do not guarantee future results.
If you are a beginner, treat this as a guide to understand how the market works — practice on paper trades before risking real money. If you are experienced, always assess your own risk, position sizing, and strategy suitability before entering trades.
Consult a SEBI-registered financial advisor before making any real trading decision. By engaging with this content, you acknowledge full responsibility for your trades and investments.
💬 Found this useful?
🔼 Give this post a Boost to help more traders discover clean, structured learning.
✍️ Drop your thoughts, questions, or setups in the comments — let’s grow together!
🔁 Share with fellow traders and beginners to spread awareness.
✅ Follow simpletradewithpatience for beginner-friendly setups, price action insights & disciplined trading content.
🚀 Stay Calm. Stay Clean. Trade With Patience.
Trade Smart | Learn Zones | Be Self-Reliant 📊
Ticker: NSE: DRREDDY | Sector: 💊 Pharma
CMP: ₹1,276.60 ▲ (+2.51% | 22 Aug 2025)
Rating (for learning purpose): ⭐⭐⭐⭐ (Moderately Bullish)
Pattern Observed: 📈 Triangle Breakout with Volume Confirmation
📰 Sentiment Analysis
👉 Overall Sentiment: Positive ✅
• Bullish Drivers: Breakout from triangle formation, Morning Star on daily, bullish PinBar on monthly, strong Q1 results with revenue & profit growth, and renewed interest in pharma sector due to healthcare demand.
• Risks (Bearish Case): Any failure to sustain above ₹1,250 or renewed pressure from regulatory issues/patent challenges could trigger pullbacks.
• Short-term Outlook: Strong breakout with momentum, but some cooling-off likely due to Stochastic overbought levels.
• Long-term Outlook: Positive — consistent financial performance, strong pharma pipeline, and robust technical structure suggest higher upside potential.
📊 Technical Snapshot
DRREDDY has broken out from a triangle formation, supported by a Morning Star candlestick on the daily timeframe and a Bullish PinBar on the monthly chart — both strong reversal cues. A bullish Supertrend, RSI breakout, and Bollinger Band expansion signal renewed buying interest. Volume above the 20-SMA average further validates the breakout, suggesting institutional participation. While momentum is strong, Stochastic is near overbought, which means short-term pullbacks cannot be ruled out. However, as long as price sustains above key support zones, the broader trend bias remains upward.
📊 Volume Check
🔹 Current Volume: 2.01M
🔹 20 SMA Volume: 1.61M ✅
💥 Above-average participation → confirms breakout reliability with demand expansion.
💡 Interpretation: Higher-than-average volumes in breakout zones indicate broader market participation and improve the chances of trend continuation.
💡 Learnings
Breakouts from consolidation patterns like triangles tend to extend into trending moves when supported by momentum indicators (RSI + MACD). Elevated CCI levels indicate consistent buying pressure, but traders should remain alert to possible short pullbacks, especially when Stochastic enters the overbought zone. Defining a stop-loss and invalidation level is key for disciplined trade management.
📌 Key Levels
Resistance: 1292 | 1308 | 1334
Support: 1251 | 1225 | 1209
Fibonacci Levels: 1138.50 | 1195.40 | 1230.65 | 1259.10 | 1287.55 | 1328.10 | 1379.70
🎯 STWP Learning Reference
• Observed breakout zone: ~1281.8
• Key support level: ~1236
• Upside reference zones (if momentum continues): 1327 | 1372
• Pullback watch zone: 1224–1230 (where demand has earlier emerged)
• Invalidation reference: Below 1195 (trend may weaken)
⚠️ Disclaimer – Please Read Carefully
The information shared here is meant purely for learning and awareness. It is not a buy or sell recommendation and should not be taken as investment advice. I am not a SEBI-registered investment advisor, and all views expressed are based on personal study, chart patterns, and publicly available market data.
Trading — whether in stocks or options — carries risk. Markets can move unexpectedly, and losses can sometimes exceed the money you have invested. Past performance or past setups do not guarantee future results.
If you are a beginner, treat this as a guide to understand how the market works — practice on paper trades before risking real money. If you are experienced, always assess your own risk, position sizing, and strategy suitability before entering trades.
Consult a SEBI-registered financial advisor before making any real trading decision. By engaging with this content, you acknowledge full responsibility for your trades and investments.
💬 Found this useful?
🔼 Give this post a Boost to help more traders discover clean, structured learning.
✍️ Drop your thoughts, questions, or setups in the comments — let’s grow together!
🔁 Share with fellow traders and beginners to spread awareness.
✅ Follow simpletradewithpatience for beginner-friendly setups, price action insights & disciplined trading content.
🚀 Stay Calm. Stay Clean. Trade With Patience.
Trade Smart | Learn Zones | Be Self-Reliant 📊
STWP | Mentor & Demand-Supply Specialist | Empowering traders through structured learning |
simpletradewithpatience.com
Community: chat.whatsapp.com/BEYz0tkqP0fJPBCWf59uel
wa.me/message/6IOPHGOXMGZ4N1
Educational Only
simpletradewithpatience.com
Community: chat.whatsapp.com/BEYz0tkqP0fJPBCWf59uel
wa.me/message/6IOPHGOXMGZ4N1
Educational Only
כתב ויתור
המידע והפרסומים אינם מיועדים להיות, ואינם מהווים, ייעוץ או המלצה פיננסית, השקעתית, מסחרית או מכל סוג אחר המסופקת או מאושרת על ידי TradingView. קרא עוד ב־תנאי השימוש.