DXY – Monthly Elliott Wave Analysis | Major Support Test Ahead - DEC 2025
Previous Analysis: https://in.tradingview.com/chart/DXY/IFfI0KeQ-DXY-MONTHLY-ANALYSIS-01-JUL-2025-96-75/
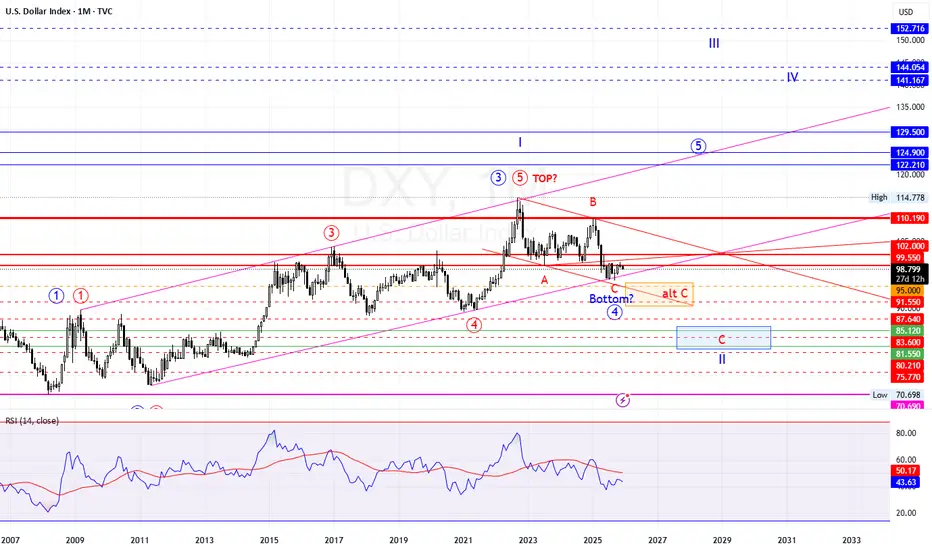
The US Dollar Index (DXY) appears to be completing a major corrective (A-B-C) structure after topping around 114.78, which is potentially the Wave ⑤ top of a long-term cycle. The index has retraced significantly and is now testing an important support zone that will determine the next long-term direction.
📍 Key Technical Highlights
🔹 Wave ⑤ Top: Formed near 114.78
🔹 Completed Wave A & B, currently in Wave C decline
🔹 Price retesting long-term trendline and Fib support area
🔹 Possible Wave (4) bottom in progress – confirmation pending
📈 Key Resistance Levels
Level Description
99.55 Immediate rejection zone
102.00 Major breakout confirmation
110.19 Strong structural resistance
114.78 Previous cycle high
📉 Key Support / C-Wave Target Zone
Support Range Notes
91.55 – 90.65 Near-term support
87.64 Structural support
83.60 – 81.55 High-probability Wave C completion zone
75.77 – 70.69 Extreme correction scenario
🔍 RSI Observation
RSI forming bullish divergence
Testing long-term support trend from 2008-2011 lows
Indicates downtrend exhaustion signs, but needs confirmation
Scenario Outlook
🟥 Bearish Continuation Preferred
As long as 99.55 – 102.00 holds as resistance,
➡️ Probability favors continuation lower into 83–81 zone to complete Wave II
🟩 Bullish Breakout Invalidates
A monthly close above 102.00
➡️ Could signal trend reversal targeting:
110.19
122.21
129.50
even 152+ in Wave III
Conclusion
📌 Long-term correction likely not finished
📌 Major bottom expected in 83–81 region unless 102 breaks
📌 Wave II final stage approaching – watch price action closely
Disclaimer
Elliott Wave analysis for educational purposes only. Not financial advice. Trade with proper risk management.
#dxy #usdx #dollarindex #dollar #index #indexes #indices #usd #eur #eurusd #fiber #currency #currencies
Previous Analysis: https://in.tradingview.com/chart/DXY/IFfI0KeQ-DXY-MONTHLY-ANALYSIS-01-JUL-2025-96-75/
The US Dollar Index (DXY) appears to be completing a major corrective (A-B-C) structure after topping around 114.78, which is potentially the Wave ⑤ top of a long-term cycle. The index has retraced significantly and is now testing an important support zone that will determine the next long-term direction.
📍 Key Technical Highlights
🔹 Wave ⑤ Top: Formed near 114.78
🔹 Completed Wave A & B, currently in Wave C decline
🔹 Price retesting long-term trendline and Fib support area
🔹 Possible Wave (4) bottom in progress – confirmation pending
📈 Key Resistance Levels
Level Description
99.55 Immediate rejection zone
102.00 Major breakout confirmation
110.19 Strong structural resistance
114.78 Previous cycle high
📉 Key Support / C-Wave Target Zone
Support Range Notes
91.55 – 90.65 Near-term support
87.64 Structural support
83.60 – 81.55 High-probability Wave C completion zone
75.77 – 70.69 Extreme correction scenario
🔍 RSI Observation
RSI forming bullish divergence
Testing long-term support trend from 2008-2011 lows
Indicates downtrend exhaustion signs, but needs confirmation
Scenario Outlook
🟥 Bearish Continuation Preferred
As long as 99.55 – 102.00 holds as resistance,
➡️ Probability favors continuation lower into 83–81 zone to complete Wave II
🟩 Bullish Breakout Invalidates
A monthly close above 102.00
➡️ Could signal trend reversal targeting:
110.19
122.21
129.50
even 152+ in Wave III
Conclusion
📌 Long-term correction likely not finished
📌 Major bottom expected in 83–81 region unless 102 breaks
📌 Wave II final stage approaching – watch price action closely
Disclaimer
Elliott Wave analysis for educational purposes only. Not financial advice. Trade with proper risk management.
#dxy #usdx #dollarindex #dollar #index #indexes #indices #usd #eur #eurusd #fiber #currency #currencies
כתב ויתור
המידע והפרסומים אינם מיועדים להיות, ואינם מהווים, ייעוץ או המלצה פיננסית, השקעתית, מסחרית או מכל סוג אחר המסופקת או מאושרת על ידי TradingView. קרא עוד ב־תנאי השימוש.
כתב ויתור
המידע והפרסומים אינם מיועדים להיות, ואינם מהווים, ייעוץ או המלצה פיננסית, השקעתית, מסחרית או מכל סוג אחר המסופקת או מאושרת על ידי TradingView. קרא עוד ב־תנאי השימוש.