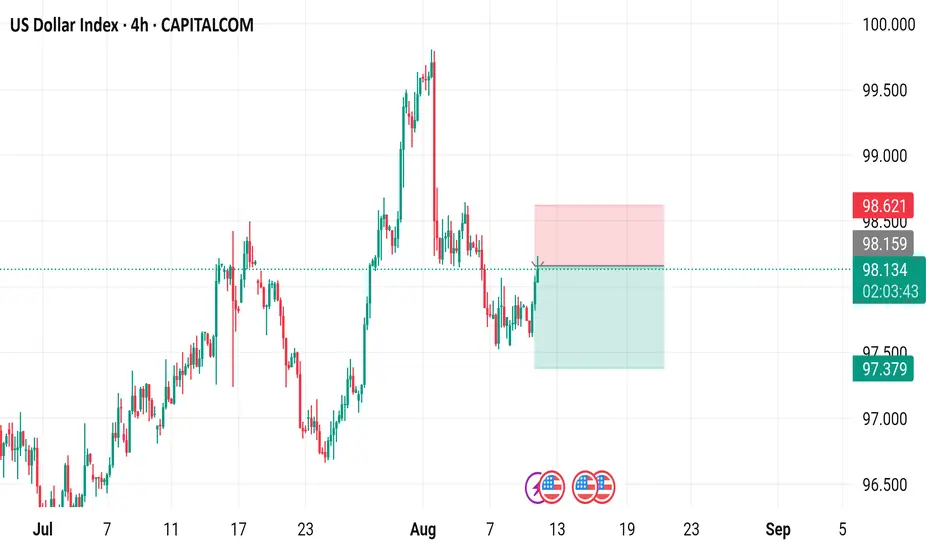
4-hour chart of the US Dollar Index (DXY) from CAPITALCOM. The chart shows the price movement of the DXY from early July to early September. The current price is 98.131 with a 0.28% increase. The chart features a candlestick pattern with green (upward movement) and red (downward movement) bars. A sell signal is indicated at 98.132, and a buy signal is at 98.186. The chart also includes highlighted zones (red and green rectangles) indicating potential trading ranges or areas of interest between approximately 98.621 and 97.379.
עסקה סגורה: היעד הושג
Target achieved כתב ויתור
המידע והפרסומים אינם מיועדים להיות, ואינם מהווים, ייעוץ או המלצה פיננסית, השקעתית, מסחרית או מכל סוג אחר המסופקת או מאושרת על ידי TradingView. קרא עוד ב־תנאי השימוש.
כתב ויתור
המידע והפרסומים אינם מיועדים להיות, ואינם מהווים, ייעוץ או המלצה פיננסית, השקעתית, מסחרית או מכל סוג אחר המסופקת או מאושרת על ידי TradingView. קרא עוד ב־תנאי השימוש.