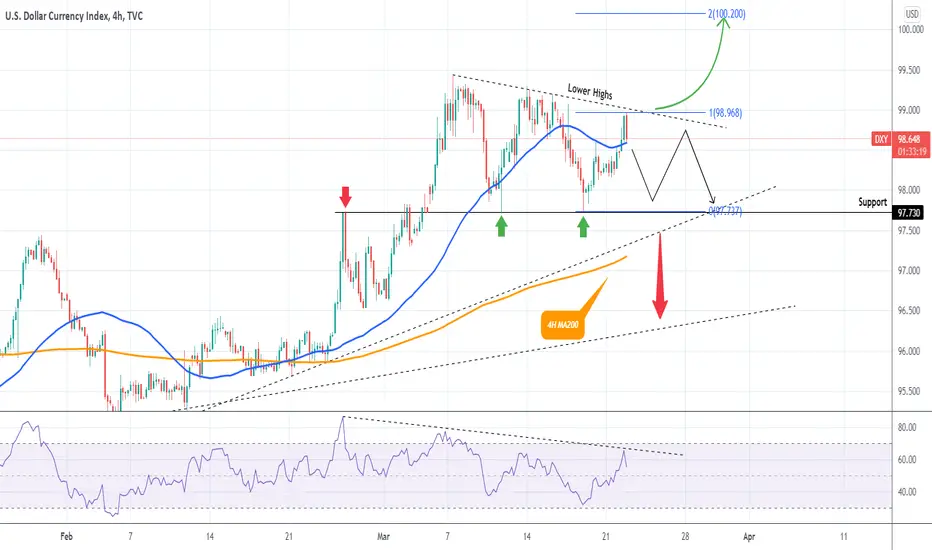
The U.S. Dollar Index just got rejected on the current 4H candle on the Lower Highs trend-line that started on the March 07 High. As long as this holds, the price should drop towards the 97.730 Support, which has already held twice, thus creating a Triangle pattern.
A break below the 4H MA200 (orange trend-line) justifies further selling towards the Lower Higher Lows trend-line (dashed), while a break above the Triangle's Lower Highs, is a break-out buy signal with a target the 2.0 Fibonacci extension (100.200).
--------------------------------------------------------------------------------------------------------
** Please support this idea with your likes and comments, it is the best way to keep it relevant and support me. **
--------------------------------------------------------------------------------------------------------
👑Best Signals (Forex/Crypto+70% accuracy) & Account Management (+20% profit/month on 10k accounts)
💰Free Channel t.me/tradingshotglobal
🤵Contact info@tradingshot.com t.me/tradingshot
🔥New service: next X100 crypto GEMS!
💰Free Channel t.me/tradingshotglobal
🤵Contact info@tradingshot.com t.me/tradingshot
🔥New service: next X100 crypto GEMS!
כתב ויתור
המידע והפרסומים אינם אמורים להיות, ואינם מהווים, עצות פיננסיות, השקעות, מסחר או סוגים אחרים של עצות או המלצות שסופקו או מאושרים על ידי TradingView. קרא עוד בתנאים וההגבלות.