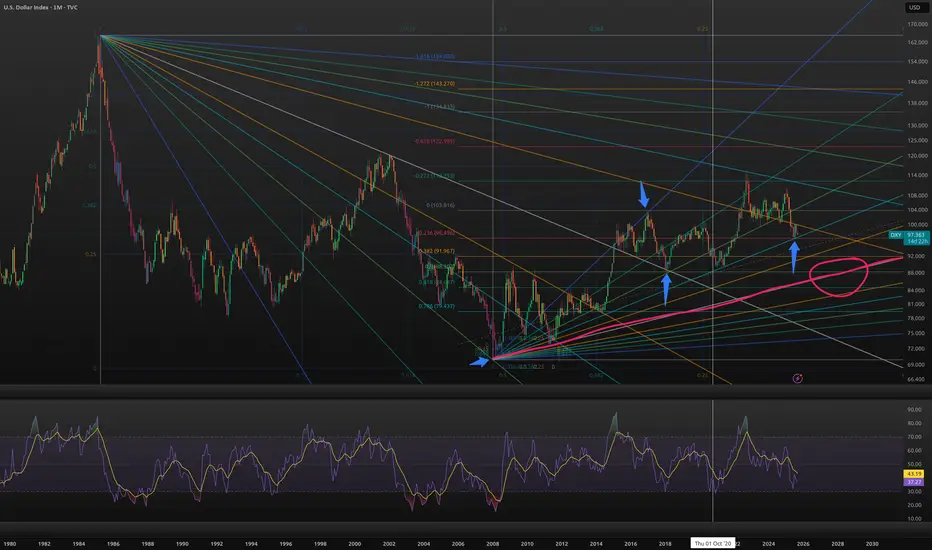
This chart has three key elements:
Note how perfect the 50% retrace is. This validates the fib. Also note that we pinned the .236 level which is also the teal fib fan line, where we've found previous support. .236 generally offers a bounce, especially combined with another key level (ascending teal trendline).
RSI momentum looks to be pulling us down. Also note the grey fib fan centerline. This is the basis for this fib fan and we touched it twice, once in 2008 and once in 20011. I believe the dollar will get back to this grey trendline, likely where I've circled, somewhere around the intersection of the 50% fib and this trendline. I would not be surprised to see a bounce to 104. We could also see 75 sometime in june/july of 26 if things start getting crazy.
- fib fan from the high in 1985
- fib fan from the low in 2008
- fib retracement. The blue arrows show the anchor, top and 50% retrace
Note how perfect the 50% retrace is. This validates the fib. Also note that we pinned the .236 level which is also the teal fib fan line, where we've found previous support. .236 generally offers a bounce, especially combined with another key level (ascending teal trendline).
RSI momentum looks to be pulling us down. Also note the grey fib fan centerline. This is the basis for this fib fan and we touched it twice, once in 2008 and once in 20011. I believe the dollar will get back to this grey trendline, likely where I've circled, somewhere around the intersection of the 50% fib and this trendline. I would not be surprised to see a bounce to 104. We could also see 75 sometime in june/july of 26 if things start getting crazy.
כתב ויתור
המידע והפרסומים אינם אמורים להיות, ואינם מהווים, עצות פיננסיות, השקעות, מסחר או סוגים אחרים של עצות או המלצות שסופקו או מאושרים על ידי TradingView. קרא עוד בתנאים וההגבלות.
כתב ויתור
המידע והפרסומים אינם אמורים להיות, ואינם מהווים, עצות פיננסיות, השקעות, מסחר או סוגים אחרים של עצות או המלצות שסופקו או מאושרים על ידי TradingView. קרא עוד בתנאים וההגבלות.