Trendlines:
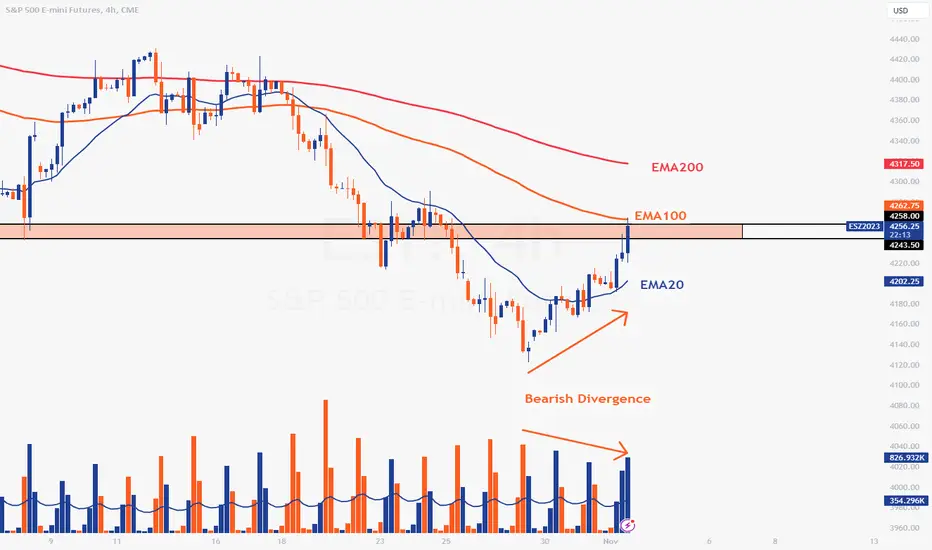
The chart showcases three Exponential Moving Averages (EMAs): EMA20 (blue), EMA100 (orange), and EMA200 (red). EMAs are used to identify trends over different periods. Here's what we can infer:
The EMA20 is currently below both the EMA100 and EMA200, suggesting that in the very short term, prices have been trending lower relative to the more extended periods.
The fact that all three EMAs are relatively close, with the price oscillating around them, may indicate a lack of a strong trend in any one direction.
Price Action:
It looks like there was a previous downtrend, as seen by the succession of lower highs and lower lows. Recently, however, the price has shown signs of a potential reversal or consolidation.
The price is currently testing the EMA100, which can act as resistance in this context. A break above this EMA could be bullish, whereas failure to surpass it might lead to further declines.
Bearish Divergence:
This is highlighted between the price action (which is making higher highs) and the momentum indicator below (which is making lower highs). This divergence suggests that while prices are increasing, the underlying momentum is weakening. Bearish divergences can be a precursor to potential price declines as they may indicate a loss of buying pressure.
Volume Bars:
The volume bars, shown in blue and orange, represent buying and selling activity, respectively. An increase in volume can validate the strength of a move. Here, we can notice some significant selling volume bars recently, which could be a cause for concern if you're bullish.
Overall Impression:
The chart appears to be at a critical juncture. The recent price action is testing significant resistance levels (EMA100), and the bearish divergence suggests caution. The next few trading sessions will be crucial in determining the potential trend direction.
העסקה בוטלה באופן ידני
it was a big surprise for me. I don't have any position in it.no pain, no gain
Unveiling illusions, revealing wealth
Unveiling illusions, revealing wealth
כתב ויתור
המידע והפרסומים אינם אמורים להיות, ואינם מהווים, עצות פיננסיות, השקעות, מסחר או סוגים אחרים של עצות או המלצות שסופקו או מאושרים על ידי TradingView. קרא עוד בתנאים וההגבלות.
no pain, no gain
Unveiling illusions, revealing wealth
Unveiling illusions, revealing wealth
כתב ויתור
המידע והפרסומים אינם אמורים להיות, ואינם מהווים, עצות פיננסיות, השקעות, מסחר או סוגים אחרים של עצות או המלצות שסופקו או מאושרים על ידי TradingView. קרא עוד בתנאים וההגבלות.