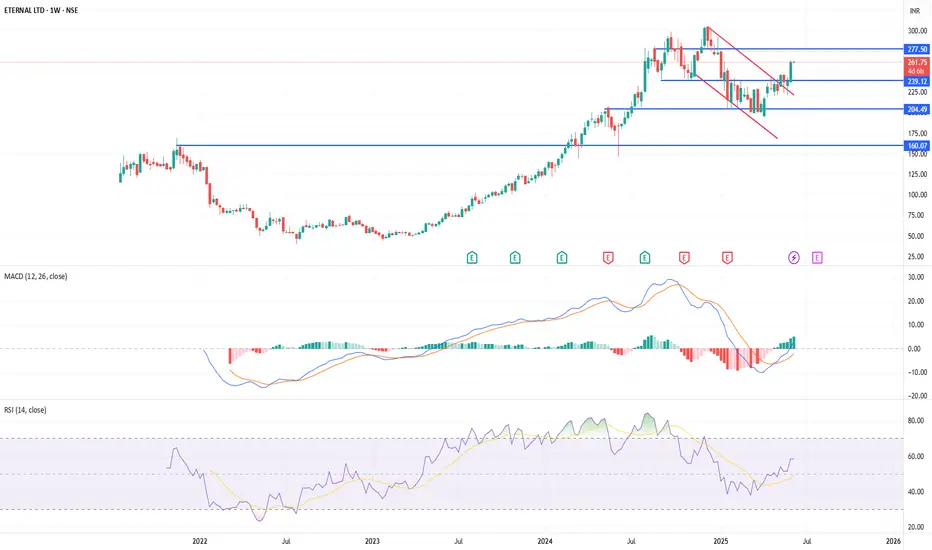
ETERNAL LTD is showing a positive technical setup on the weekly chart as of June 9, 2025. The stock has broken out of a falling wedge pattern and retested the same breakout zone of 230 levels, indicating a potential bullish reversal. Momentum indicators support the move, with the MACD moving upwards and the RSI rising to 58.5, suggesting strengthening buying interest without being overbought. This is just for educational purpose and not any recommendation.
כתב ויתור
המידע והפרסומים אינם מיועדים להיות, ואינם מהווים, ייעוץ או המלצה פיננסית, השקעתית, מסחרית או מכל סוג אחר המסופקת או מאושרת על ידי TradingView. קרא עוד ב־תנאי השימוש.
כתב ויתור
המידע והפרסומים אינם מיועדים להיות, ואינם מהווים, ייעוץ או המלצה פיננסית, השקעתית, מסחרית או מכל סוג אחר המסופקת או מאושרת על ידי TradingView. קרא עוד ב־תנאי השימוש.