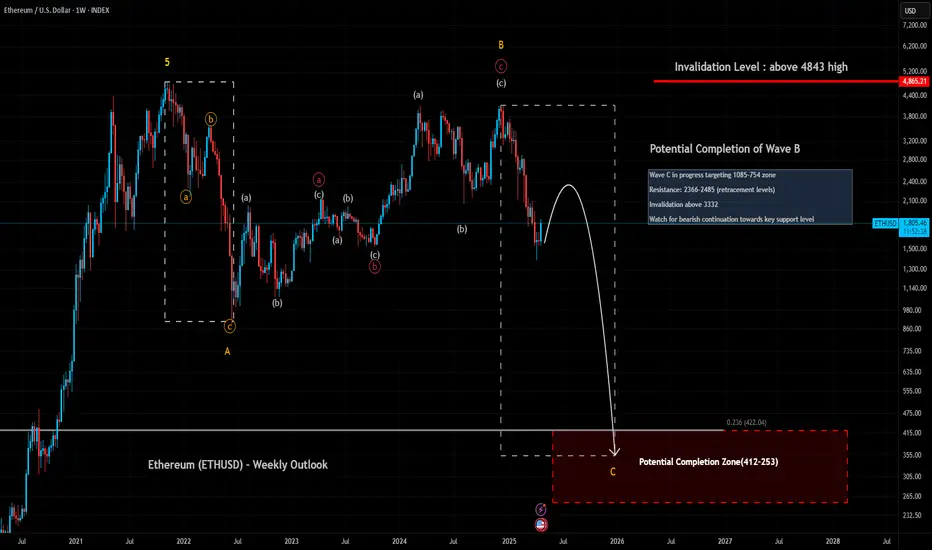
On the weekly chart, Ethereum appears to have completed a corrective Wave B inside the larger flat structure.
We are now monitoring the beginning stages of Wave C downward, following the major B top.
Immediate resistance levels are seen around $2366 and $2485 zones (0.5 and 0.618 retracement).
Key support is aligned with the $1085 level as the first major zone.
📈 For a broader context, please refer to my Monthly Ethereum analysis.
📉 For more tactical short-term entries, check my Daily Ethereum analysis.
#Ethereum #ETH #WeeklyChart #TechnicalAnalysis #ElliottWave #CryptoTrading #BearishScenario
כתב ויתור
המידע והפרסומים אינם אמורים להיות, ואינם מהווים, עצות פיננסיות, השקעות, מסחר או סוגים אחרים של עצות או המלצות שסופקו או מאושרים על ידי TradingView. קרא עוד בתנאים וההגבלות.
כתב ויתור
המידע והפרסומים אינם אמורים להיות, ואינם מהווים, עצות פיננסיות, השקעות, מסחר או סוגים אחרים של עצות או המלצות שסופקו או מאושרים על ידי TradingView. קרא עוד בתנאים וההגבלות.