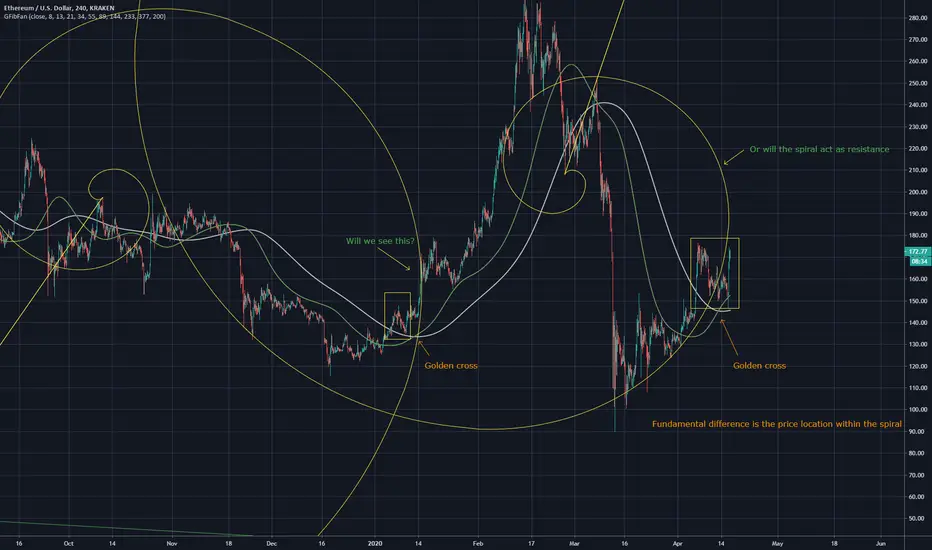
Comparison of two similar points on Ethereum
The previous golden cross produced a run that was on the INSIDE of the fibonacci spiral
While this golden cross is on the outside of the fib spiral, will this repeat? Or will it act as a resistance

Here is my bottoms chart for Ethereum showing bottom points and potential future bottoms
The previous golden cross produced a run that was on the INSIDE of the fibonacci spiral
While this golden cross is on the outside of the fib spiral, will this repeat? Or will it act as a resistance
Here is my bottoms chart for Ethereum showing bottom points and potential future bottoms
כתב ויתור
המידע והפרסומים אינם אמורים להיות, ואינם מהווים, עצות פיננסיות, השקעות, מסחר או סוגים אחרים של עצות או המלצות שסופקו או מאושרים על ידי TradingView. קרא עוד בתנאים וההגבלות.
כתב ויתור
המידע והפרסומים אינם אמורים להיות, ואינם מהווים, עצות פיננסיות, השקעות, מסחר או סוגים אחרים של עצות או המלצות שסופקו או מאושרים על ידי TradingView. קרא עוד בתנאים וההגבלות.