Spot Strategy | 0xPareto Thesis
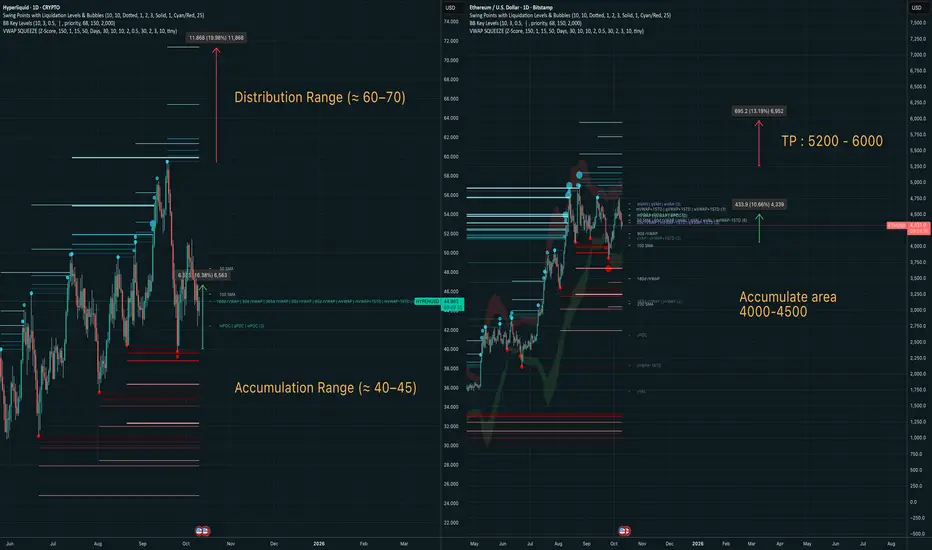
This chart visualizes the ongoing macro accumulation phase across both Ethereum and Hyperliquid, aligning with cyclical VWAP structure and liquidity maps.
Ethereum (Right):
Accumulation area: $4,000–$4,500
Target: $5,200–$6,000
Hyperliquid (Left):
Accumulation range: $40–$45
Distribution range: $60–$70
Mean reversion setup with high confluence on 180d VWAP and prior liquidity clusters.
כתב ויתור
המידע והפרסומים אינם מיועדים להיות, ואינם מהווים, ייעוץ או המלצה פיננסית, השקעתית, מסחרית או מכל סוג אחר המסופקת או מאושרת על ידי TradingView. קרא עוד ב־תנאי השימוש.
כתב ויתור
המידע והפרסומים אינם מיועדים להיות, ואינם מהווים, ייעוץ או המלצה פיננסית, השקעתית, מסחרית או מכל סוג אחר המסופקת או מאושרת על ידי TradingView. קרא עוד ב־תנאי השימוש.