📊 ETH/USDT – 4H Chart Analysis
1️⃣ Descending Channel:
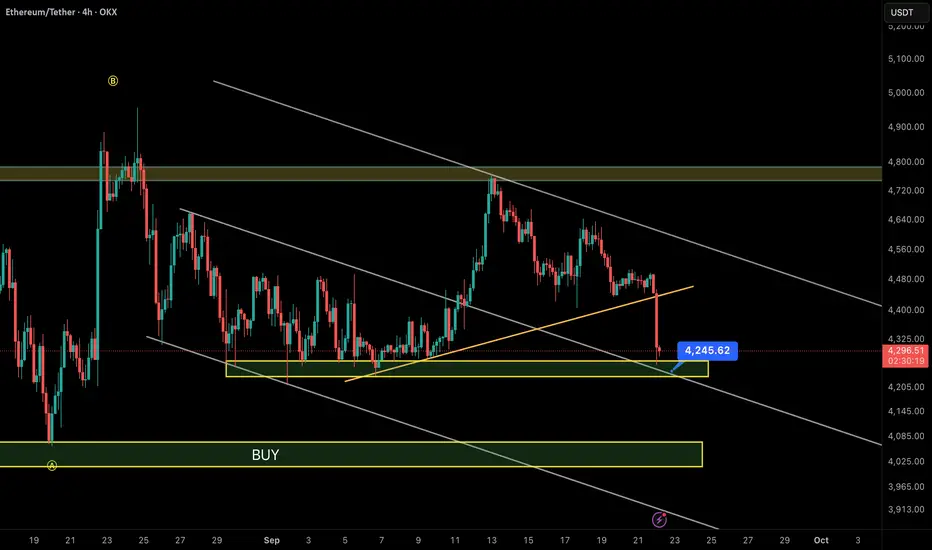
Ethereum is still moving inside a clear descending channel. Sellers remain in control as every rally to the channel top has been rejected.
2️⃣ Trendline Break:
The short-term ascending trendline (orange) has just been broken with strong selling pressure, dragging the price into the $4,200 – $4,250 support zone.
3️⃣ Key Support Zone:
The first major support lies at $4,200 – $4,250. If this level holds, ETH could see a short-term rebound toward $4,400 – $4,600.
4️⃣ Main Buy Zone:
If $4,200 fails, the next strong demand zone sits at $3,950 – $4,100, aligning with the lower boundary of the descending channel. This is where stronger buying interest is expected.
5️⃣ Resistance Levels:
• Near-term: $4,450 – $4,600
• Major: $4,750 – $4,800
⚖️ Summary:
• Bullish scenario: Holding $4,200 → bounce to $4,400 / $4,600.
• Bearish scenario: Losing $4,200 → drop to $4,000 – $3,950 (main BUY zone).
👉 At this stage, trading in the middle of the channel is risky. Safer entries come either near $4,000 – $4,100 or after a confirmed breakout above $4,600.
1️⃣ Descending Channel:
Ethereum is still moving inside a clear descending channel. Sellers remain in control as every rally to the channel top has been rejected.
2️⃣ Trendline Break:
The short-term ascending trendline (orange) has just been broken with strong selling pressure, dragging the price into the $4,200 – $4,250 support zone.
3️⃣ Key Support Zone:
The first major support lies at $4,200 – $4,250. If this level holds, ETH could see a short-term rebound toward $4,400 – $4,600.
4️⃣ Main Buy Zone:
If $4,200 fails, the next strong demand zone sits at $3,950 – $4,100, aligning with the lower boundary of the descending channel. This is where stronger buying interest is expected.
5️⃣ Resistance Levels:
• Near-term: $4,450 – $4,600
• Major: $4,750 – $4,800
⚖️ Summary:
• Bullish scenario: Holding $4,200 → bounce to $4,400 / $4,600.
• Bearish scenario: Losing $4,200 → drop to $4,000 – $3,950 (main BUY zone).
👉 At this stage, trading in the middle of the channel is risky. Safer entries come either near $4,000 – $4,100 or after a confirmed breakout above $4,600.
📊 CryptoPilot – Advanced Technical Analysis for BTC & Altcoins
🔎 Smart Money • Price Action • NeoWave • Multi-Timeframe Context
📩 Contact: @CryptoPilot_1 (Telegram)
📥 Telegram Chanell : @CryptoPilot_Trading
🔎 Smart Money • Price Action • NeoWave • Multi-Timeframe Context
📩 Contact: @CryptoPilot_1 (Telegram)
📥 Telegram Chanell : @CryptoPilot_Trading
פרסומים קשורים
כתב ויתור
המידע והפרסומים אינם אמורים להיות, ואינם מהווים, עצות פיננסיות, השקעות, מסחר או סוגים אחרים של עצות או המלצות שסופקו או מאושרים על ידי TradingView. קרא עוד בתנאים וההגבלות.