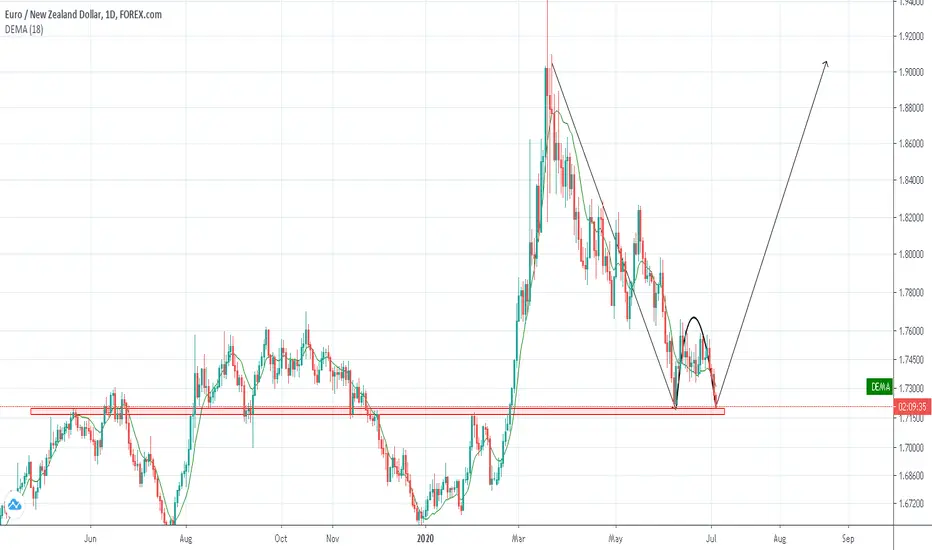
i think its simple to understand long term support and resistance as will as now double bottom created
Double top and double bottom are reversal chart patterns observed in the technical analysis of financial trading markets of stocks, commodities, currencies, and other assets.
A double bottom is the end formation in a declining market. It is identical to the double top, except for the inverse relationship in price. The pattern is formed by two price minima separated by local peak defining the neck line. The formation is completed and confirmed when the price rises above the neck line, indicating that further price rise is imminent or highly likely.
Most of the rules that are associated with double top formation also apply to the double bottom pattern. Volume should show a marked increase on the rally up while prices are flat at the second bottom
כתב ויתור
המידע והפרסומים אינם אמורים להיות, ואינם מהווים, עצות פיננסיות, השקעות, מסחר או סוגים אחרים של עצות או המלצות שסופקו או מאושרים על ידי TradingView. קרא עוד בתנאים וההגבלות.
כתב ויתור
המידע והפרסומים אינם אמורים להיות, ואינם מהווים, עצות פיננסיות, השקעות, מסחר או סוגים אחרים של עצות או המלצות שסופקו או מאושרים על ידי TradingView. קרא עוד בתנאים וההגבלות.