Trade idea.
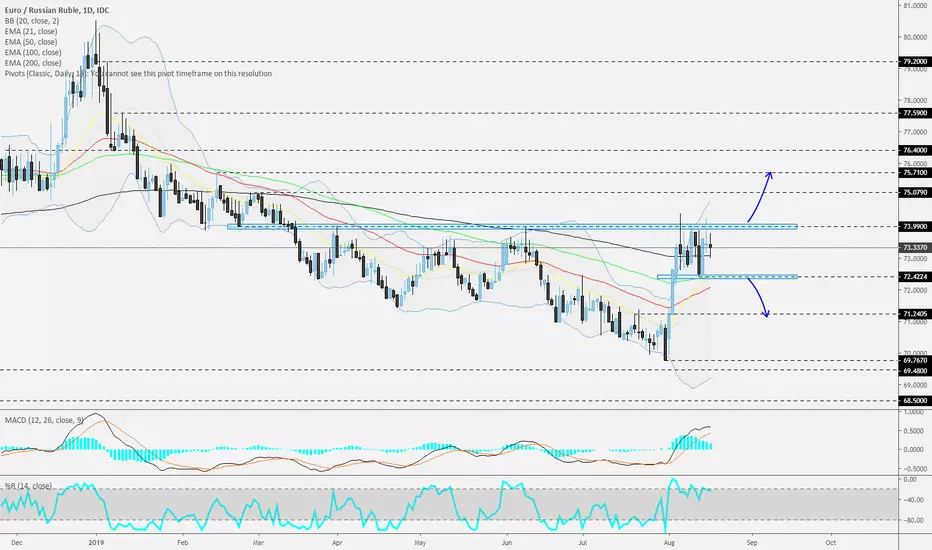
EURRUB could be forming a flag on the daily chart. Currently, the pair is sitting around its 200 EMA. For now, we will sit back, relax and wait for a clear break through one of the highlighted areas before we examine a further directional move. If the pair breaks through the 74.00 zone and closes a daily candle above it, this might confirm a possible flag and the rate may accelerate further, as more buyers could be joining in.
Please see the chart for details.
Don't forget your stop-loss.
הערה
Please join our daily live quick technical market overview webinars - Trader’s Espresso and Trader’s Tea Time - on YouTube.Trader’s Espresso – 06:00 GMT
Trader’s Tea Time – 13:15 GMT
כתב ויתור
המידע והפרסומים אינם מיועדים להיות, ואינם מהווים, ייעוץ או המלצה פיננסית, השקעתית, מסחרית או מכל סוג אחר המסופקת או מאושרת על ידי TradingView. קרא עוד ב־תנאי השימוש.
כתב ויתור
המידע והפרסומים אינם מיועדים להיות, ואינם מהווים, ייעוץ או המלצה פיננסית, השקעתית, מסחרית או מכל סוג אחר המסופקת או מאושרת על ידי TradingView. קרא עוד ב־תנאי השימוש.