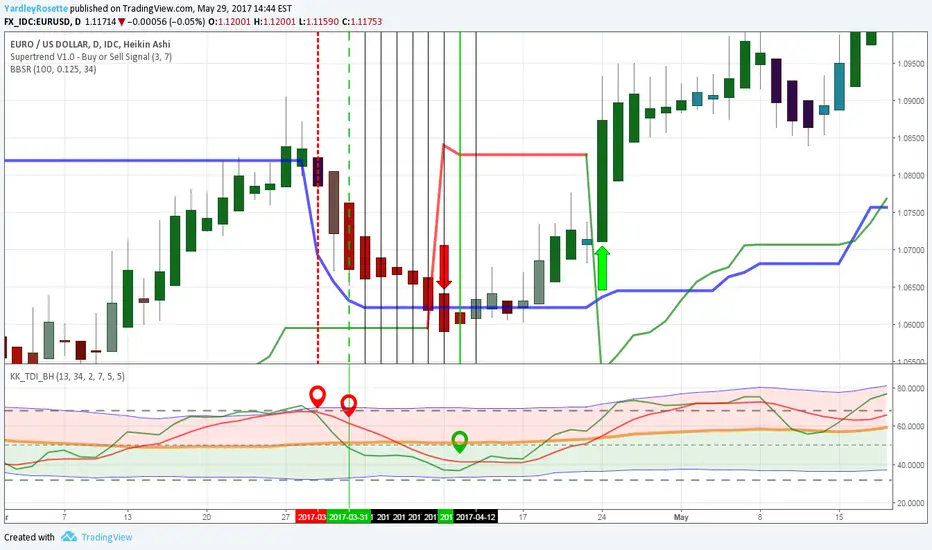
RSI/TSI cross down signal ocurred.
RSI/TSI remains bearish, though 1H Dynamic Index indication, simple/generic buy entry conditions/rules of:
RSI/TSI having been oversold, MBL risen from near 32, & RSI/TSI cross MBL up & RSI to cross above Volatility Band High were met.
Lower Time Frames indicate bullish movement within Daily chart.
Daily chart RSI/TSI cross up follows, bullish trend>>
כתב ויתור
המידע והפרסומים אינם אמורים להיות, ואינם מהווים, עצות פיננסיות, השקעות, מסחר או סוגים אחרים של עצות או המלצות שסופקו או מאושרים על ידי TradingView. קרא עוד בתנאים וההגבלות.
כתב ויתור
המידע והפרסומים אינם אמורים להיות, ואינם מהווים, עצות פיננסיות, השקעות, מסחר או סוגים אחרים של עצות או המלצות שסופקו או מאושרים על ידי TradingView. קרא עוד בתנאים וההגבלות.