Analysis on FB Inc, US as 5 june 2020
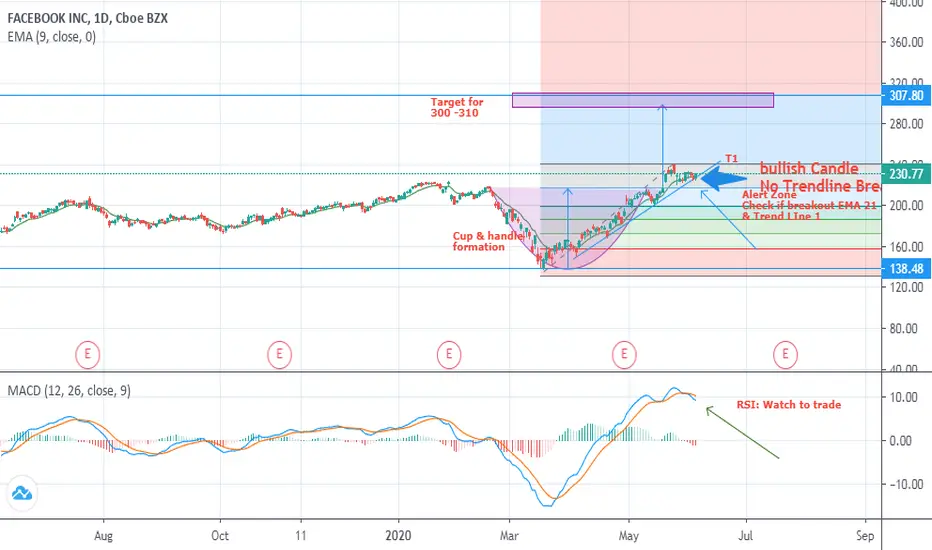
Chart Patterns: Cup & Handle Formation indicating next targe to $300 - 310
Candle: bullish Candle No Trendline Breakout as per 5 june candle
Alert Zone, Check if breakout EMA 21 & Trend LIne 1
RSI: Watch to trade Trend ; Sideway, Watch to trade
Candle: bullish Candle No Trendline Breakout as per 5 june candle
Alert Zone, Check if breakout EMA 21 & Trend LIne 1
RSI: Watch to trade Trend ; Sideway, Watch to trade
כתב ויתור
המידע והפרסומים אינם אמורים להיות, ואינם מהווים, עצות פיננסיות, השקעות, מסחר או סוגים אחרים של עצות או המלצות שסופקו או מאושרים על ידי TradingView. קרא עוד בתנאים וההגבלות.
כתב ויתור
המידע והפרסומים אינם אמורים להיות, ואינם מהווים, עצות פיננסיות, השקעות, מסחר או סוגים אחרים של עצות או המלצות שסופקו או מאושרים על ידי TradingView. קרא עוד בתנאים וההגבלות.