Analysis:
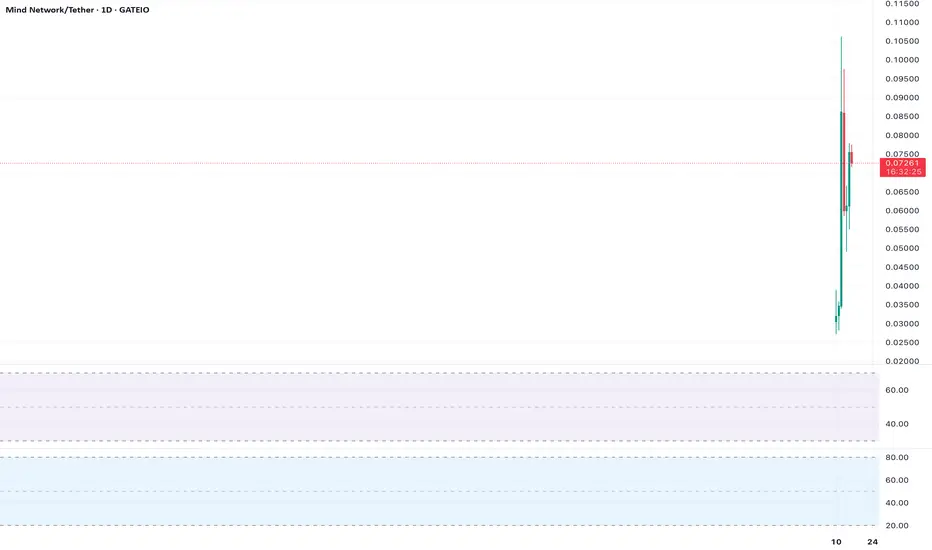
 FHE’s daily chart shows a potential double bottom at $0.00000075, a bullish pattern. The price is at $0.00000079, with RSI rising from oversold levels (30). A move above $0.00000085 confirms the pattern, targeting $0.0000011. Low volume is a risk.
Actionable Insight:
Long on a break above $0.00000085, targeting $0.0000011. Stop-loss at $0.00000074. Confirm with volume before entry.
Chart Setup:
Timeframe: Daily
Indicators: RSI, Double Bottom
Levels: Neckline ($0.00000085), Target ($0.0000011)
Actionable Insight:
Long on a break above $0.00000085, targeting $0.0000011. Stop-loss at $0.00000074. Confirm with volume before entry.
Chart Setup:
Timeframe: Daily
Indicators: RSI, Double Bottom
Levels: Neckline ($0.00000085), Target ($0.0000011)
כתב ויתור
המידע והפרסומים אינם אמורים להיות, ואינם מהווים, עצות פיננסיות, השקעות, מסחר או סוגים אחרים של עצות או המלצות שסופקו או מאושרים על ידי TradingView. קרא עוד בתנאים וההגבלות.
כתב ויתור
המידע והפרסומים אינם אמורים להיות, ואינם מהווים, עצות פיננסיות, השקעות, מסחר או סוגים אחרים של עצות או המלצות שסופקו או מאושרים על ידי TradingView. קרא עוד בתנאים וההגבלות.
