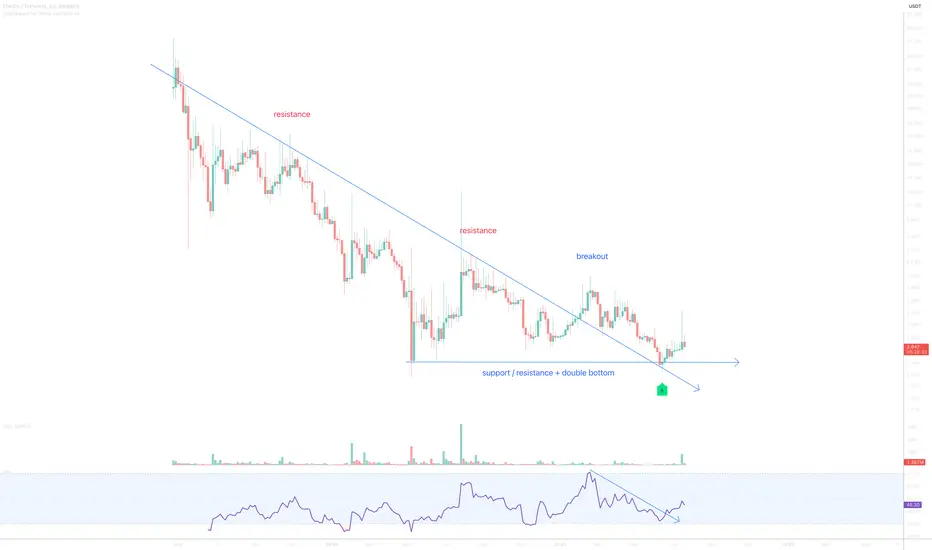
On the above 4-day chart price action has corrected over 90%. Today is great long opportunity. Why?
1) RSI and price action resistance breakouts.
2) Multiple oscillators print bullish divergence with price action.
3) Price action prints support on past resistance since breakout. Look left.
Is it possible price action falls further? Sure.
Is it probable? No.
Ww
Type: trade
Risk: <=6% of portfolio
Timeframe: Now, don’t sit on your hands.
Return: no idea
עסקה פעילה
הערה
40%הערה
an excellent momentעסקה פעילה
הערה
This one is a proper pump n dump, be careful. A long position from under 2.60 is great.
הערה
Hold from under 2.60 until 5 dollaעסקה פעילה
Well done if you grabbed the sellers tokens for cheap under 2.60.. they'll be seeing red once price action strikes 8 dollars.עסקה פעילה
GRM support confirmedעסקה פעילה
הערה
4.60 resistance confirms support.הערה
Past resistance confirms support, prepare yourself.. boom is coming.כתב ויתור
המידע והפרסומים אינם מיועדים להיות, ואינם מהווים, ייעוץ או המלצה פיננסית, השקעתית, מסחרית או מכל סוג אחר המסופקת או מאושרת על ידי TradingView. קרא עוד ב־תנאי השימוש.
כתב ויתור
המידע והפרסומים אינם מיועדים להיות, ואינם מהווים, ייעוץ או המלצה פיננסית, השקעתית, מסחרית או מכל סוג אחר המסופקת או מאושרת על ידי TradingView. קרא עוד ב־תנאי השימוש.