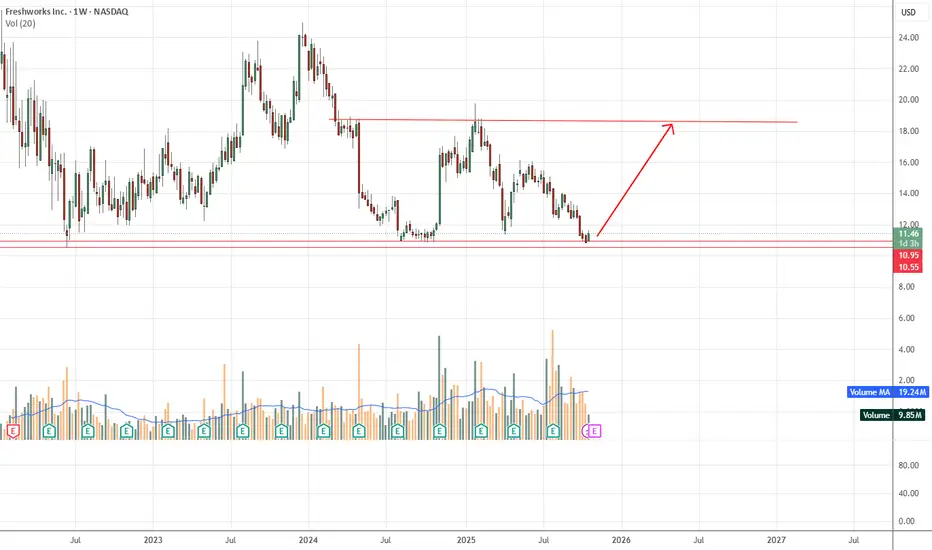
The stock is currently trading around $11.44, near its recent support zone at roughly $10.55–$10.95.
The chart shows a downtrend from previous highs, but price is testing a historically strong support level.
Resistance: Around $18 (where the upward arrow points), representing prior swing highs.
Bullish setup at current levels with clear risk/reward: low risk near support, high reward toward prior resistance.
Traders may look for confirmation (bullish candlestick, volume increase) before entering.
עסקה פעילה
כתב ויתור
המידע והפרסומים אינם מיועדים להיות, ואינם מהווים, ייעוץ או המלצה פיננסית, השקעתית, מסחרית או מכל סוג אחר המסופקת או מאושרת על ידי TradingView. קרא עוד ב־תנאי השימוש.
כתב ויתור
המידע והפרסומים אינם מיועדים להיות, ואינם מהווים, ייעוץ או המלצה פיננסית, השקעתית, מסחרית או מכל סוג אחר המסופקת או מאושרת על ידי TradingView. קרא עוד ב־תנאי השימוש.