Cup & Handle Formation, Pivot Breakout, and Downtrend Line (DTL)
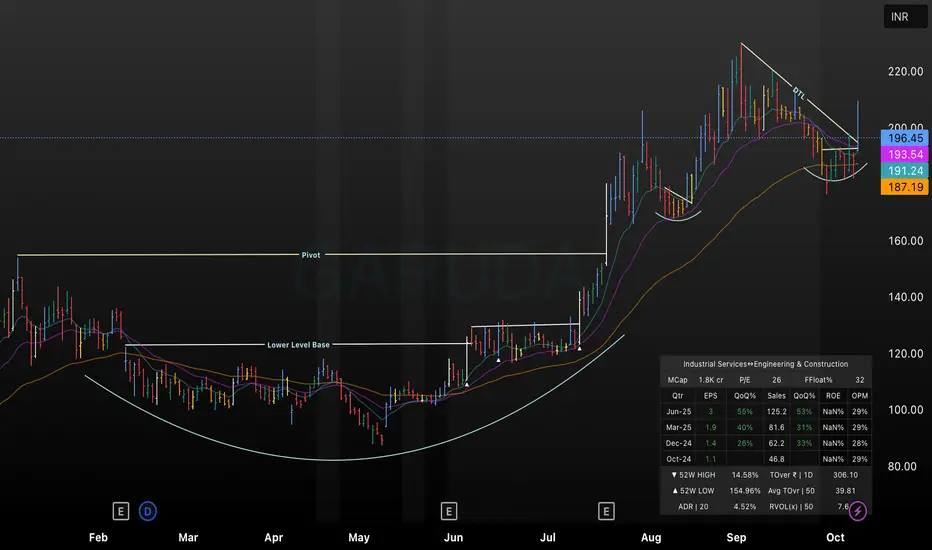
This TradingView chart displays a classic cup and handle pattern marked by a rounded lower-level base and a pivot breakout zone. Price consolidates under a descending trendline (DTL), which it recently broke, signaling a potential bullish trend continuation. Moving averages support the ascending momentum after the breakout, while quarterly earnings and financial data reinforce fundamental strength. This setup serves as a prime example of blending technical patterns with fundamental insights for strategic trade entries.
כתב ויתור
המידע והפרסומים אינם אמורים להיות, ואינם מהווים, עצות פיננסיות, השקעות, מסחר או סוגים אחרים של עצות או המלצות שסופקו או מאושרים על ידי TradingView. קרא עוד בתנאים וההגבלות.
כתב ויתור
המידע והפרסומים אינם אמורים להיות, ואינם מהווים, עצות פיננסיות, השקעות, מסחר או סוגים אחרים של עצות או המלצות שסופקו או מאושרים על ידי TradingView. קרא עוד בתנאים וההגבלות.