Part 1 : Direction
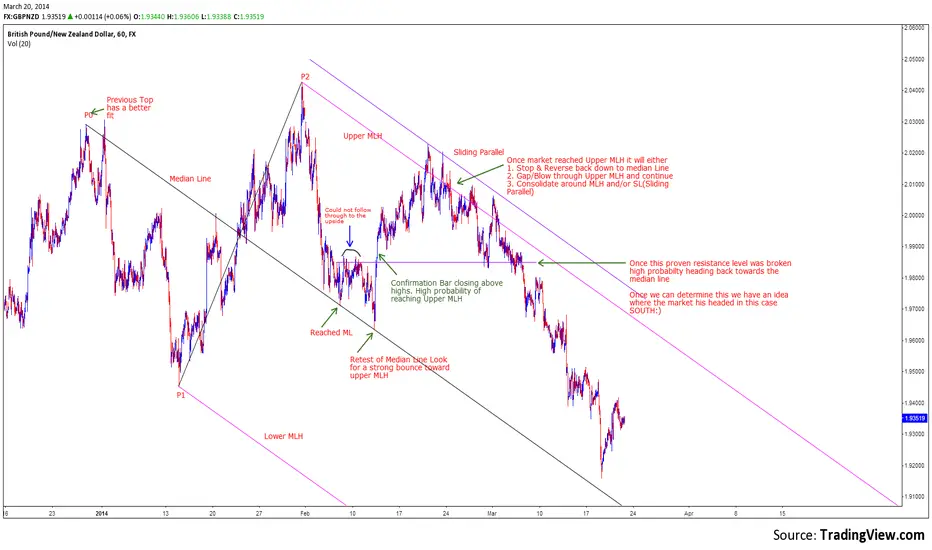
This is a 60 minute chart of the GBP/NZD pair. It was drawn after the first touch of the median line.
The horizontal purple support & resistance line within the median line set gives us directional bias as to market direction. In part two I will zoom in closer and see what the forks are telling me.
This is a 60 minute chart of the GBP/NZD pair. It was drawn after the first touch of the median line.
The horizontal purple support & resistance line within the median line set gives us directional bias as to market direction. In part two I will zoom in closer and see what the forks are telling me.
כתב ויתור
המידע והפרסומים אינם אמורים להיות, ואינם מהווים, עצות פיננסיות, השקעות, מסחר או סוגים אחרים של עצות או המלצות שסופקו או מאושרים על ידי TradingView. קרא עוד בתנאים וההגבלות.
כתב ויתור
המידע והפרסומים אינם אמורים להיות, ואינם מהווים, עצות פיננסיות, השקעות, מסחר או סוגים אחרים של עצות או המלצות שסופקו או מאושרים על ידי TradingView. קרא עוד בתנאים וההגבלות.