📉 1-Month Performance
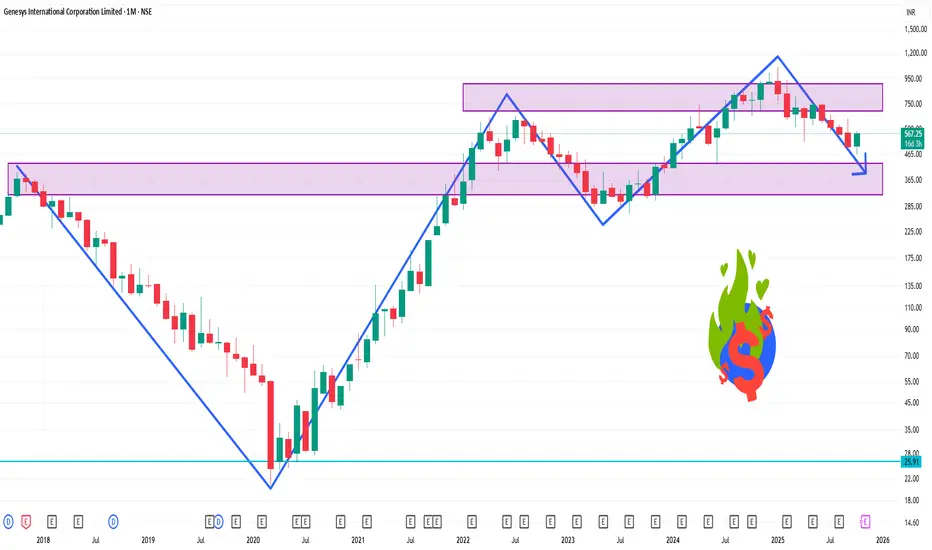
Price Change: The stock has declined by approximately 15.81% over the past month.
INDmoney
Recent Trend: Despite the monthly decline, the stock experienced a significant uptick today, closing at ₹575.55, up from ₹479.65.
📊 Technical Indicators (1-Month View)
Relative Strength Index (RSI): The RSI is at 23.10, indicating that the stock is in the oversold territory and may be due for a rebound.
Moving Averages
20-Day Exponential Moving Average (EMA): ₹526.60 (suggests a sell signal as the current price is below this level).
50-Day EMA: ₹565.84 (also indicates a sell signal).
100-Day EMA: ₹608.98 (further confirming the downtrend).
MACD: The Moving Average Convergence Divergence (MACD) is at -28.90, suggesting a bearish trend.
Pivot Points:
Resistance Levels: R1: ₹491.28, R2: ₹505.12, R3: ₹513.33.
Support Levels: S1: ₹469.23, S2: ₹461.02, S3: ₹447.18.
פרסומים קשורים
כתב ויתור
המידע והפרסומים אינם מיועדים להיות, ואינם מהווים, ייעוץ או המלצה פיננסית, השקעתית, מסחרית או מכל סוג אחר המסופקת או מאושרת על ידי TradingView. קרא עוד ב־תנאי השימוש.
פרסומים קשורים
כתב ויתור
המידע והפרסומים אינם מיועדים להיות, ואינם מהווים, ייעוץ או המלצה פיננסית, השקעתית, מסחרית או מכל סוג אחר המסופקת או מאושרת על ידי TradingView. קרא עוד ב־תנאי השימוש.