Price action and chart pattern trading:
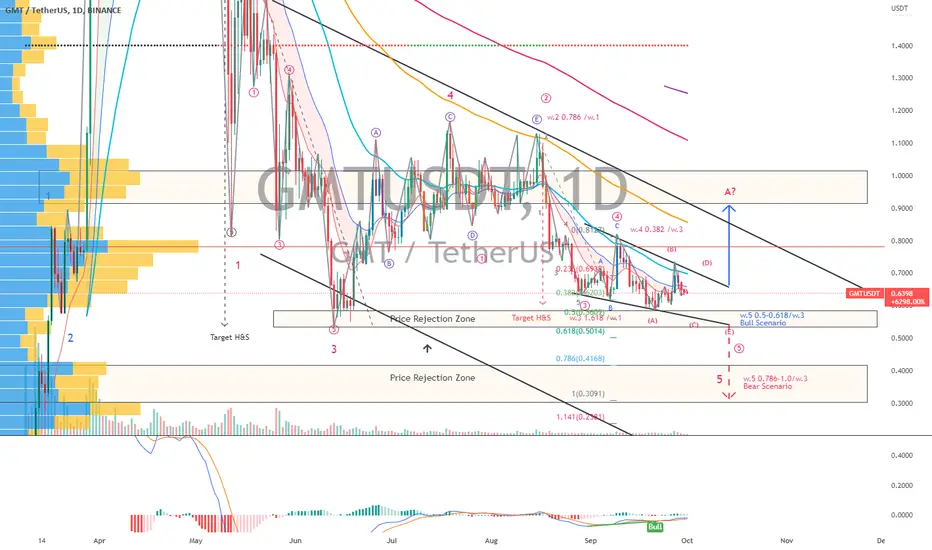
> A possible local 4-wave triangle pattern with a bullish divergence signal
> A bull scenario with the target downtrend triangle @ 0.5-0.618 fibonanci extension of current minor 3-wave once breakout current price rejection zone previous low.
> Short entry if breakout of triangle for a bear scenario, the target could reach upto 0.786-1.0 extension for the next support zone
Always trade with affordable risk and respect your stoploss, nothing is 100%.
כתב ויתור
המידע והפרסומים אינם אמורים להיות, ואינם מהווים, עצות פיננסיות, השקעות, מסחר או סוגים אחרים של עצות או המלצות שסופקו או מאושרים על ידי TradingView. קרא עוד בתנאים וההגבלות.
כתב ויתור
המידע והפרסומים אינם אמורים להיות, ואינם מהווים, עצות פיננסיות, השקעות, מסחר או סוגים אחרים של עצות או המלצות שסופקו או מאושרים על ידי TradingView. קרא עוד בתנאים וההגבלות.