📊 Professional Analysis
Timeframe & Price Action
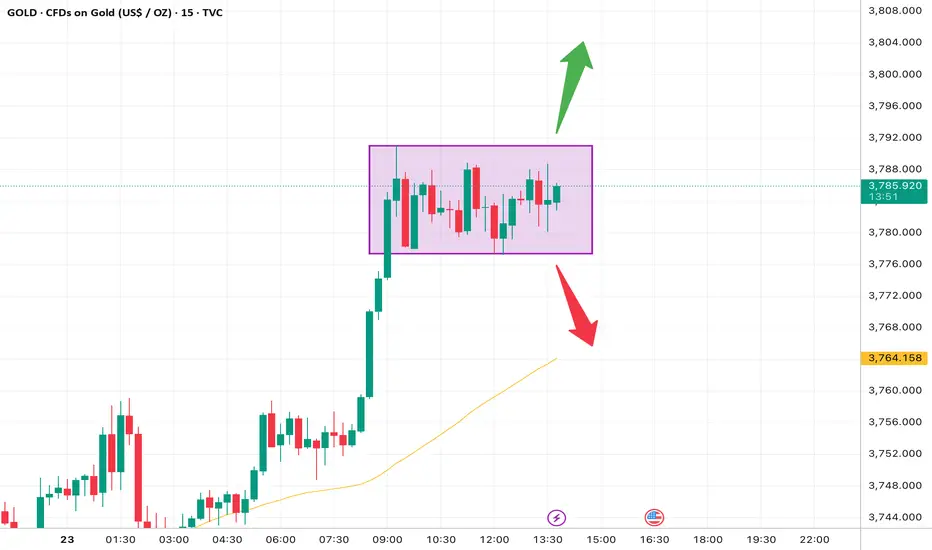
This is XAUUSD on the 15-minute chart. After a strong bullish impulse, price has entered a sideways consolidation range between 3780 – 3790 (purple box).
Market Structure
Prior trend: Strong bullish rally.
Current action: A box/range formation — the market is gathering liquidity before the next move.
This is often a continuation pattern, but both directions remain possible.
Moving Average
The yellow line (likely 50-period MA) is trending upward and is well below current price, confirming the bullish bias. However, the distance suggests a possible short-term pullback if the range breaks downward.
Scenarios
🔼 Bullish Breakout:
If price closes above 3790, next upside targets are 3805 (first resistance) and 3810–3812 (extended target).
🔽 Bearish Breakdown:
A break and close below 3780 could trigger a drop toward 3765 and possibly 3760–3755 near the MA support.
🎯 Trading Plan (15-Minute Setup)
Bullish Scenario (Breakout Up)
Entry: Above 3790 after a confirmed 15M candle close.
Stop Loss: Below the box, around 3778.
Take Profit:
TP1: 3805
TP2: 3810 – 3812
Bearish Scenario (Breakout Down)
Entry: Below 3780 with confirmation.
Stop Loss: Above the box, around 3793.
Take Profit:
TP1: 3765
TP2: 3755 – 3760 (near the MA).
⚖️ Risk Management & Notes
On the 15M chart, false breakouts are common — wait for a full candle close beyond the box.
Keep risk per trade around 1–2% max.
Momentum is still bullish, so the upside breakout has slightly higher probability, but always be prepared for the downside scenario.
Timeframe & Price Action
This is XAUUSD on the 15-minute chart. After a strong bullish impulse, price has entered a sideways consolidation range between 3780 – 3790 (purple box).
Market Structure
Prior trend: Strong bullish rally.
Current action: A box/range formation — the market is gathering liquidity before the next move.
This is often a continuation pattern, but both directions remain possible.
Moving Average
The yellow line (likely 50-period MA) is trending upward and is well below current price, confirming the bullish bias. However, the distance suggests a possible short-term pullback if the range breaks downward.
Scenarios
🔼 Bullish Breakout:
If price closes above 3790, next upside targets are 3805 (first resistance) and 3810–3812 (extended target).
🔽 Bearish Breakdown:
A break and close below 3780 could trigger a drop toward 3765 and possibly 3760–3755 near the MA support.
🎯 Trading Plan (15-Minute Setup)
Bullish Scenario (Breakout Up)
Entry: Above 3790 after a confirmed 15M candle close.
Stop Loss: Below the box, around 3778.
Take Profit:
TP1: 3805
TP2: 3810 – 3812
Bearish Scenario (Breakout Down)
Entry: Below 3780 with confirmation.
Stop Loss: Above the box, around 3793.
Take Profit:
TP1: 3765
TP2: 3755 – 3760 (near the MA).
⚖️ Risk Management & Notes
On the 15M chart, false breakouts are common — wait for a full candle close beyond the box.
Keep risk per trade around 1–2% max.
Momentum is still bullish, so the upside breakout has slightly higher probability, but always be prepared for the downside scenario.
כתב ויתור
המידע והפרסומים אינם אמורים להיות, ואינם מהווים, עצות פיננסיות, השקעות, מסחר או סוגים אחרים של עצות או המלצות שסופקו או מאושרים על ידי TradingView. קרא עוד בתנאים וההגבלות.
כתב ויתור
המידע והפרסומים אינם אמורים להיות, ואינם מהווים, עצות פיננסיות, השקעות, מסחר או סוגים אחרים של עצות או המלצות שסופקו או מאושרים על ידי TradingView. קרא עוד בתנאים וההגבלות.