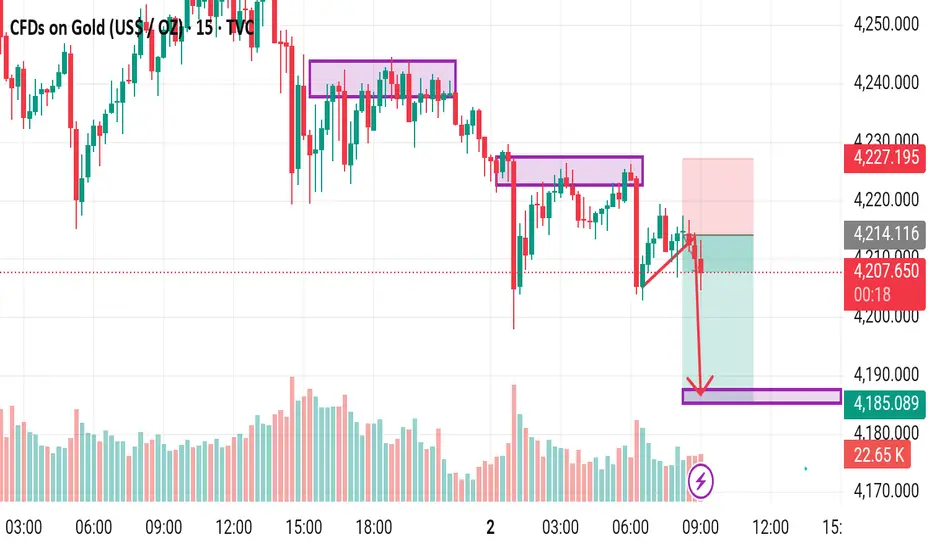
Price reacted multiple times from the highlighted supply blocks, forming a sequence of lower highs. After a clean rejection within the most recent premium zone, momentum shifted to the downside, guiding price toward the previously identified demand zone near 4185.
Key observations:
• Liquidity sweep occurred before the downside move
• Repeated supply zone rejection confirmed the shift in pressure
• Minor structure broke with clear displacement
• Price is gravitating toward an untested demand area below
This chart highlights how supply–demand rotation, combined with liquidity behavior, shapes intraday directional flow and explains why certain zones act as magnets for price.
כתב ויתור
המידע והפרסומים אינם מיועדים להיות, ואינם מהווים, ייעוץ או המלצה פיננסית, השקעתית, מסחרית או מכל סוג אחר המסופקת או מאושרת על ידי TradingView. קרא עוד ב־תנאי השימוש.
כתב ויתור
המידע והפרסומים אינם מיועדים להיות, ואינם מהווים, ייעוץ או המלצה פיננסית, השקעתית, מסחרית או מכל סוג אחר המסופקת או מאושרת על ידי TradingView. קרא עוד ב־תנאי השימוש.