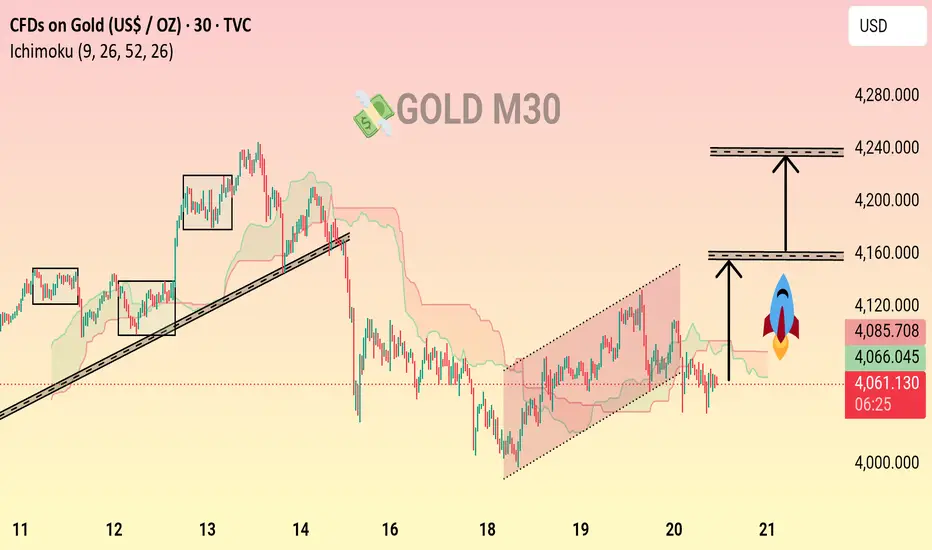
Gold on the M30 timeframe shows a well-defined trend structure with previous consolidation zones, a broken ascending trendline, and a newly formed rising channel. Price is currently testing key support near 4,060, with breakout targets mapped upward. The chart highlights potential bullish continuation levels toward the 4,200 zone.”
Option B – Trader-Focused
“This M30 Gold chart maps recent consolidation blocks, trendline breaks, and the current ascending channel. Price is ranging near support, with two projected breakout targets above. Market structure suggests a potential bullish continuation if price holds above the cloud and breaks the resistance zone.”
Option C – Short & Punchy
“M30 Gold chart highlighting structure shifts, rising channel development, and breakout targets toward the 4,200 region.”
Option D – More Detailed
“Gold on the 30-minute chart displays earlier distribution zones followed by a significant drop and the formation of a new bullish channel. With Ichimoku support holding and clear resistance layers identified, the chart outlines probable breakout pathways and upside targets for upcoming sessions.”
Gold is consolidating after forming a rising channel. Price is sitting near a key support zone around 4,060. A breakout above the highlighted resistance area could open the path toward 4,150–4,200. If support fails, price may revisit the lower channel levels. Overall structure leans cautiously bullish as long as price holds above the rising channel support
עסקה פעילה
Trade active running 850+ pips Join free telegram channel
t.me/+UlkzSENzAv4wOTc0
Daily 3-5 signals
Xauusd Gold updates
Free signal telegram channel
t.me/+pA0kQEvdgQ9hMWM0
t.me/+UlkzSENzAv4wOTc0
Daily 3-5 signals
Xauusd Gold updates
Free signal telegram channel
t.me/+pA0kQEvdgQ9hMWM0
פרסומים קשורים
כתב ויתור
המידע והפרסומים אינם מיועדים להיות, ואינם מהווים, ייעוץ או המלצה פיננסית, השקעתית, מסחרית או מכל סוג אחר המסופקת או מאושרת על ידי TradingView. קרא עוד ב־תנאי השימוש.
Join free telegram channel
t.me/+UlkzSENzAv4wOTc0
Daily 3-5 signals
Xauusd Gold updates
Free signal telegram channel
t.me/+pA0kQEvdgQ9hMWM0
t.me/+UlkzSENzAv4wOTc0
Daily 3-5 signals
Xauusd Gold updates
Free signal telegram channel
t.me/+pA0kQEvdgQ9hMWM0
פרסומים קשורים
כתב ויתור
המידע והפרסומים אינם מיועדים להיות, ואינם מהווים, ייעוץ או המלצה פיננסית, השקעתית, מסחרית או מכל סוג אחר המסופקת או מאושרת על ידי TradingView. קרא עוד ב־תנאי השימוש.