Gold (XAU/USD) Technical Analysis – 30-Minute Chart
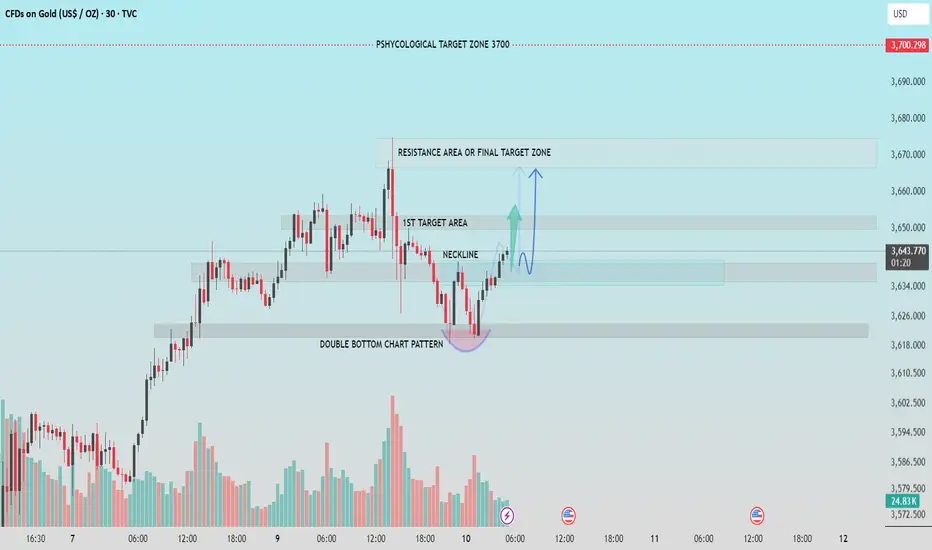
The chart shows a clear Double Bottom chart pattern near the $3,618–$3,620 support zone, indicating potential bullish reversal. This is a classic bullish pattern, often signaling the end of a downtrend and beginning of an upward move.
▪️Neckline Breakout
The neckline of the double bottom has been successfully broken around the $3,638 level, confirming the pattern. Price has retested the neckline and is now attempting to move higher.
▪️Key Target Zones
1st Target Area: $3,648–$3,652
Price is approaching the first resistance zone, which may act as short-term resistance.
Final Target / Resistance Zone: $3,668–$3,675
A breakout above the first target may drive price toward the final resistance zone.
▪️Psychological Target Zone: $3,700
This remains a significant psychological level and long-term bullish target if momentum continues.
▪️Volume Analysis
Volume increased notably during the formation and breakout of the double bottom, adding strength to the bullish reversal signal.
▪️Outlook
As long as price holds above the neckline support (~$3,638), the bullish scenario remains valid with potential targets of $3,652 and $3,675. Failure to hold above the neckline may invalidate the pattern.
If this helpful for you, press the like button.
עסקה פעילה
from 3640, after breakout & retest of double bottom .הערה
1st target achieved,הערה
הערה
the one more layer was added from 3616, with sl 3610 & it's going 400 pips+ .עסקה סגורה: היעד הושג
💸FREE FOREX Signals in Telegram : t.me/FxInsightsHub0
🔹Join Our Telegram Channel, Pure Price Action Based Signals With Chart Analysis.
t.me/FxInsightsHub0
🚀FREE CRYPTO Signals In Telegram: t.me/FxInsightsHub0
🔹Join Our Telegram Channel, Pure Price Action Based Signals With Chart Analysis.
t.me/FxInsightsHub0
🚀FREE CRYPTO Signals In Telegram: t.me/FxInsightsHub0
פרסומים קשורים
כתב ויתור
המידע והפרסומים אינם אמורים להיות, ואינם מהווים, עצות פיננסיות, השקעות, מסחר או סוגים אחרים של עצות או המלצות שסופקו או מאושרים על ידי TradingView. קרא עוד בתנאים וההגבלות.