Chart Analysis:
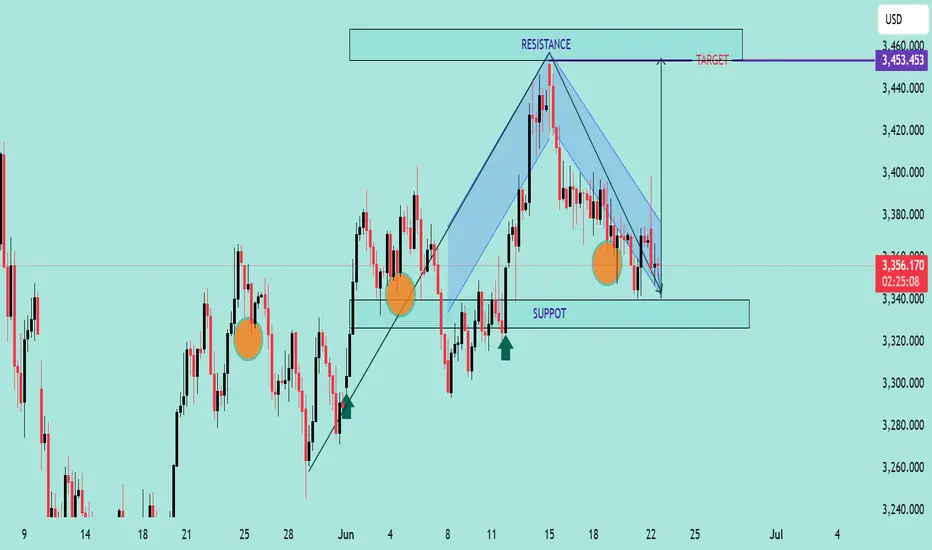
The chart illustrates a Falling Wedge Pattern, a bullish reversal setup typically signaling a breakout to the upside.
📌 Key Observations:
📉 Downward Channel: Price has been compressing within a falling wedge (highlighted in blue), indicating potential exhaustion of sellers.
💪 Support Zone: Strong support observed near the 3,340 level, with price rejecting this zone multiple times (highlighted with orange circles).
🔼 Bullish Signals: Price recently tested the lower wedge boundary and bounced, suggesting potential reversal.
🎯 Breakout Target: Projected target after breakout is around 3,453.453 USD, aligned with previous resistance zone.
🟢 Buy Pressure Arrows: Green arrows signal previous bullish reactions from similar demand zones.
📈 Conclusion:
If price breaks above the wedge’s upper boundary with volume confirmation, a bullish rally toward 3,453 is expected. Keep an eye on breakout retest for entry validation.
✅ Trading Plan Suggestion:
Entry: On breakout above wedge resistance
SL: Below recent swing low (~3,330)
TP: 3,453 zone 🎯
🔔 Note: Wait for a confirmed breakout before entering to avoid false signals.
JOIN MY TELEGRAM CHANNEL
t.me/StellarMarketAnalysis
JOIN MY RECOMMENTED BROKER REFFREL LINK
⤵️one.exnesstrack.net/a/uvd1etcgg1
PARTNER CODE⤵️
uvd1etcgg1
t.me/StellarMarketAnalysis
JOIN MY RECOMMENTED BROKER REFFREL LINK
⤵️one.exnesstrack.net/a/uvd1etcgg1
PARTNER CODE⤵️
uvd1etcgg1
כתב ויתור
המידע והפרסומים אינם אמורים להיות, ואינם מהווים, עצות פיננסיות, השקעות, מסחר או סוגים אחרים של עצות או המלצות שסופקו או מאושרים על ידי TradingView. קרא עוד בתנאים וההגבלות.