With just over ten hours until the gold market opens, I'll briefly review last week's market performance and outline my strategy for next week.
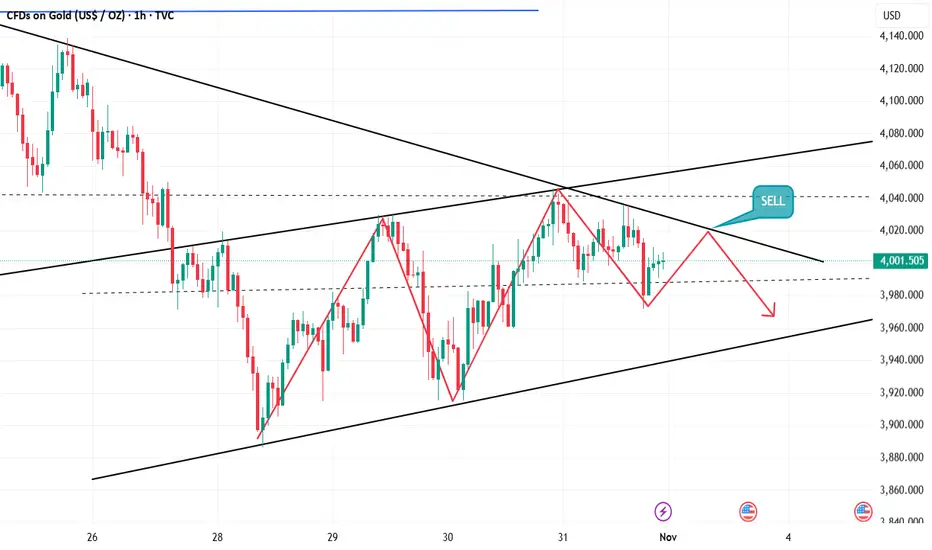
On Friday, gold rose to 4046 in the Asian session before encountering resistance and falling back. After retracing to 3990, it tested the trendline resistance level again, before falling back again in the US session, resulting in significant volatility throughout the day.
As mentioned on Friday, the volatile market offers opportunities for both bulls and bears. The key lies in the entry point. If the Asian session rises, the European session retraces and breaks the low, and the US session surges, it's a bull trap. Once the high point appears, go short. We followed this approach and achieved good results.
Gold continues to fluctuate, and next week will be crucial for whether the gold bulls can regain their footing. If gold continues its strong performance on Monday, it is likely that the rebound will continue, but it will be a rebound, and the daily chart of gold will then begin a long period of adjustment.
The gold market will continue to face numerous uncertainties, and the battle between bulls and bears is expected to continue. From a news perspective, a series of important economic data will be released next week, such as the US non-farm payrolls and PMI data. The performance of these data will directly affect market expectations for the US economic outlook, and thus influence gold price movements. In addition, speeches by Federal Reserve officials and developments in the geopolitical situation also require close attention.
Next week, the initial resistance level for gold is expected to be in the $4050-$4070 range. This area represents the previous rebound high and the location of the 5-week moving average, making it a relatively strong resistance level. If gold prices can break through this resistance level, they may further challenge the resistance near $4100. The key support level is at $3950, which is the starting point of this week's rebound and the lower Bollinger Band support on the daily chart. A break below this level could lead to a further decline to around $3900 for support.
Next week's trading plan will be launched soon. If you have any trading questions, please feel free to contact me.
עסקה פעילה
Hi traders! What do u think about GOLD?עסקה סגורה: היעד הושג
Gold prices have been fluctuating around the 4000 level, reaching a high of 4036 last Friday before falling back to 3960. After breaking out of the converging triangle pattern, a directional move is expected. As long as the 4050-60 level holds, the correction is not over.The US government shutdown has lasted a month, with delayed economic data releases and government officials on leave. How long can the paralyzed US maintain this state? Reopening is only a matter of time, and a bipartisan agreement could trigger panic selling in gold.
Today, gold is expected to continue its pullback within the 4030 range, with a stop-loss above 4050. The key level is a potential breach of 3960. As long as the starting point of the decline is not broken, the weak consolidation is not over.
Join my telegram channel for free t.me/GoldBitcoinSharing To follow the link, click on the globe icon on the next line
פרסומים קשורים
כתב ויתור
המידע והפרסומים אינם מיועדים להיות, ואינם מהווים, ייעוץ או המלצה פיננסית, השקעתית, מסחרית או מכל סוג אחר המסופקת או מאושרת על ידי TradingView. קרא עוד ב־תנאי השימוש.