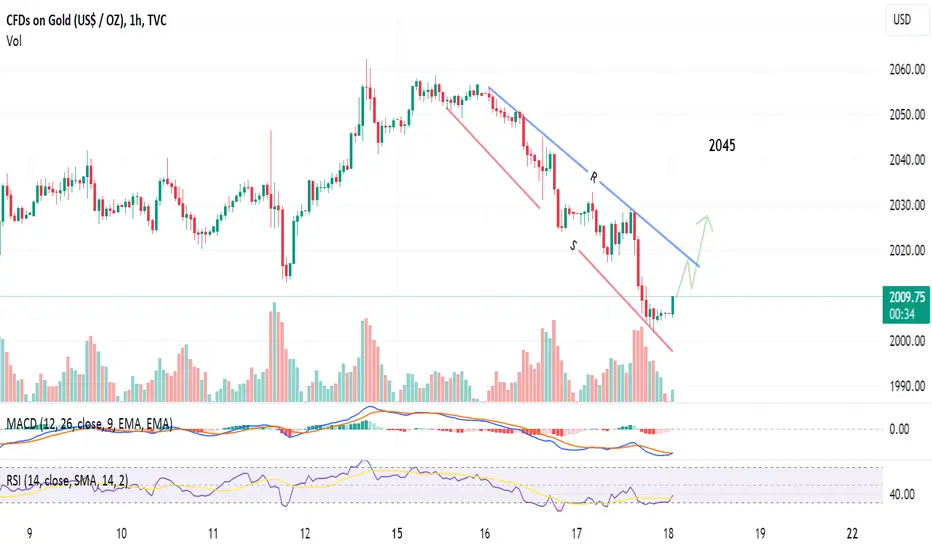
1-hour chart, GOLD is trading in a falling expanding triangle; and is expected to test the resistance at around 2018. After crossing Resistance line (blue), the target will be 2045
Both technical indicators RSI and MACD are positive - supporting this view.
Both technical indicators RSI and MACD are positive - supporting this view.
עסקה פעילה
עסקה פעילה
Potential for more upside movement..כתב ויתור
המידע והפרסומים אינם מיועדים להיות, ואינם מהווים, ייעוץ או המלצה פיננסית, השקעתית, מסחרית או מכל סוג אחר המסופקת או מאושרת על ידי TradingView. קרא עוד ב־תנאי השימוש.
כתב ויתור
המידע והפרסומים אינם מיועדים להיות, ואינם מהווים, ייעוץ או המלצה פיננסית, השקעתית, מסחרית או מכל סוג אחר המסופקת או מאושרת על ידי TradingView. קרא עוד ב־תנאי השימוש.