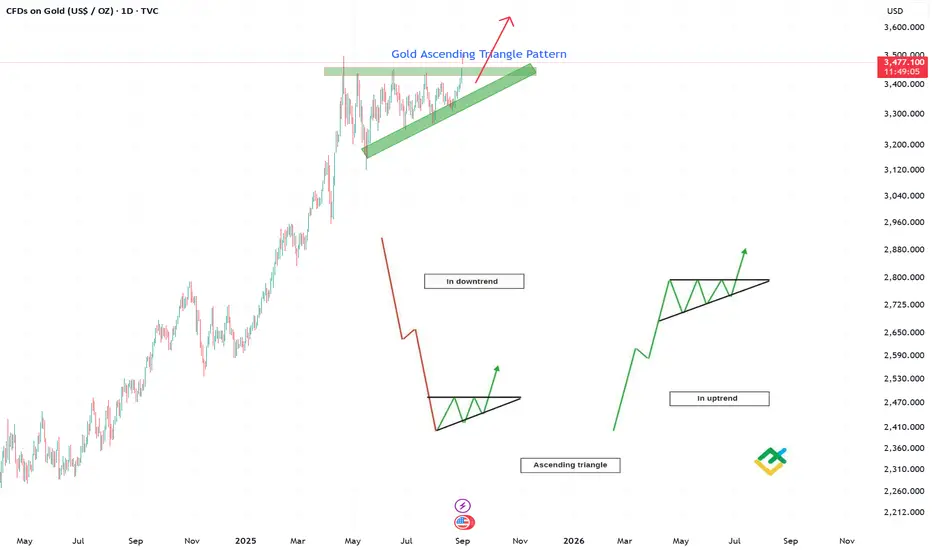
Gold is coiling up for a major move. The daily chart reveals a classic Ascending Triangle, a powerful bullish continuation pattern, suggesting the uptrend is ready to resume.
Key Pattern Elements:
Resistance: A flat, horizontal resistance level has formed around the $3,460 - $3,480 zone. This level has been tested multiple times, confirming its significance as a major hurdle.
Support: A rising trendline connects a series of higher lows, indicating consistent and strengthening buying pressure.
Trade Plan & Key Levels:
Entry Signal (Long): A decisive daily candle close above $3,480. A surge in volume on the breakout would provide strong confirmation.
Price Target: Based on the height of the triangle, the measured move projects a target near $3,800.
Invalidation: The bullish setup is negated if the price breaks down below the ascending support trendline.
Conclusion:
The battle between buyers and sellers is nearing its climax. The structure strongly favors the bulls. Patience is key—wait for a confirmed breakout above resistance before entering a long position. This setup offers a clear path to new all-time highs.
Disclaimer: This is not financial advice. Always conduct your own analysis.
כתב ויתור
המידע והפרסומים אינם מיועדים להיות, ואינם מהווים, ייעוץ או המלצה פיננסית, השקעתית, מסחרית או מכל סוג אחר המסופקת או מאושרת על ידי TradingView. קרא עוד ב־תנאי השימוש.
כתב ויתור
המידע והפרסומים אינם מיועדים להיות, ואינם מהווים, ייעוץ או המלצה פיננסית, השקעתית, מסחרית או מכל סוג אחר המסופקת או מאושרת על ידי TradingView. קרא עוד ב־תנאי השימוש.