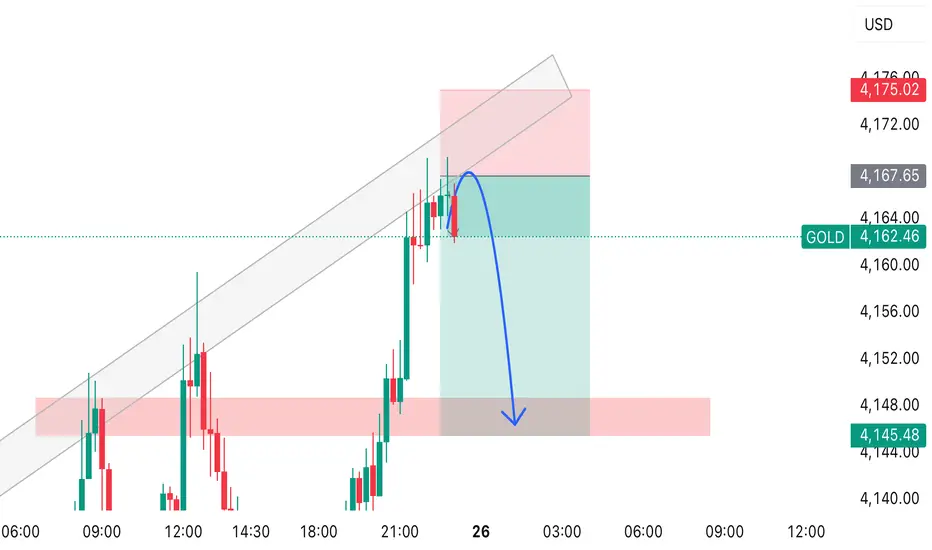
This TradingView chart shows GOLD price action approaching a resistance zone near 4167–4170 USD.
Price has been moving inside an ascending channel, shown with grey trendlines.
At the top of the channel, a rejection candle appears, and you’ve drawn a blue arrow indicating your expected move:
📉 Expected Move
• Price is expected to drop from the resistance zone.
• The arrow shows a move down towards the support demand zone near 4145–4150 USD (highlighted in red).
עסקה פעילה
Active עסקה סגורה: היעד הושג
Target reached 🔥כתב ויתור
המידע והפרסומים אינם מיועדים להיות, ואינם מהווים, ייעוץ או המלצה פיננסית, השקעתית, מסחרית או מכל סוג אחר המסופקת או מאושרת על ידי TradingView. קרא עוד ב־תנאי השימוש.
כתב ויתור
המידע והפרסומים אינם מיועדים להיות, ואינם מהווים, ייעוץ או המלצה פיננסית, השקעתית, מסחרית או מכל סוג אחר המסופקת או מאושרת על ידי TradingView. קרא עוד ב־תנאי השימוש.