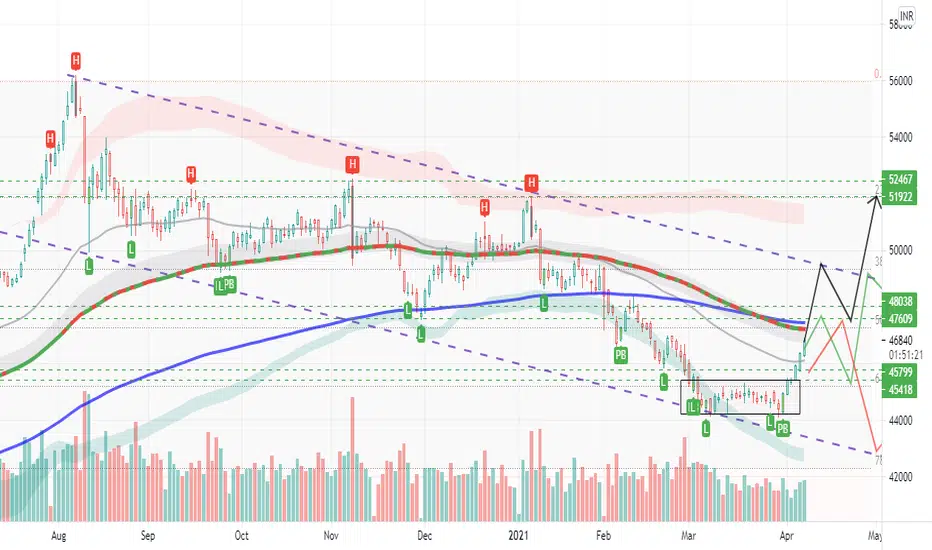
The Indicator Used:
1) TE-REKAB - Proprietary Indicator
KEYS:
PB: Pullback
H/Blue Candle: Selling Divergence
L/Yellow Candle: Buying Divergence
2) Daily Lines Plots Daily 50 EMA (GREY) & BLUE (200 DAILY EMA ) On Lower Time Frame Charts.
3) Valuation band
KEYS: Red Faded Cloud: Over Valuation.
Grey Faded Cloud: Proper Valuation.
Green Faded Cloud: Under Valuation.
PANEL 2:
פרסומים קשורים
כתב ויתור
המידע והפרסומים אינם מיועדים להיות, ואינם מהווים, ייעוץ או המלצה פיננסית, השקעתית, מסחרית או מכל סוג אחר המסופקת או מאושרת על ידי TradingView. קרא עוד ב־תנאי השימוש.
פרסומים קשורים
כתב ויתור
המידע והפרסומים אינם מיועדים להיות, ואינם מהווים, ייעוץ או המלצה פיננסית, השקעתית, מסחרית או מכל סוג אחר המסופקת או מאושרת על ידי TradingView. קרא עוד ב־תנאי השימוש.