Gold has reached its most overbought level on a monthly basis in 45 years. Not only that, but it is also overbought on a daily and weekly basis, a feat that is not only rare but troubling.
The RSI on gold is now well above 70 on the daily, weekly, and monthly charts. It is not merely that gold’s RSI is above 70 – it has reached a staggering 89.6 on the monthly chart, a level not seen since January 1980, when it peaked at 91.2 and closed that month at $681.50. It then took more than 27 years for gold to register a new monthly closing high in September 2007.

Currently, the weekly chart exhibits similarly overbought conditions, with an RSI reading of 76, while trading above its upper Bollinger band for what appears to be four consecutive weeks. In addition, the %b – which measures how far above the upper Bollinger band the price of gold is – stands at 1.12, indicating that it is historically quite stretched.

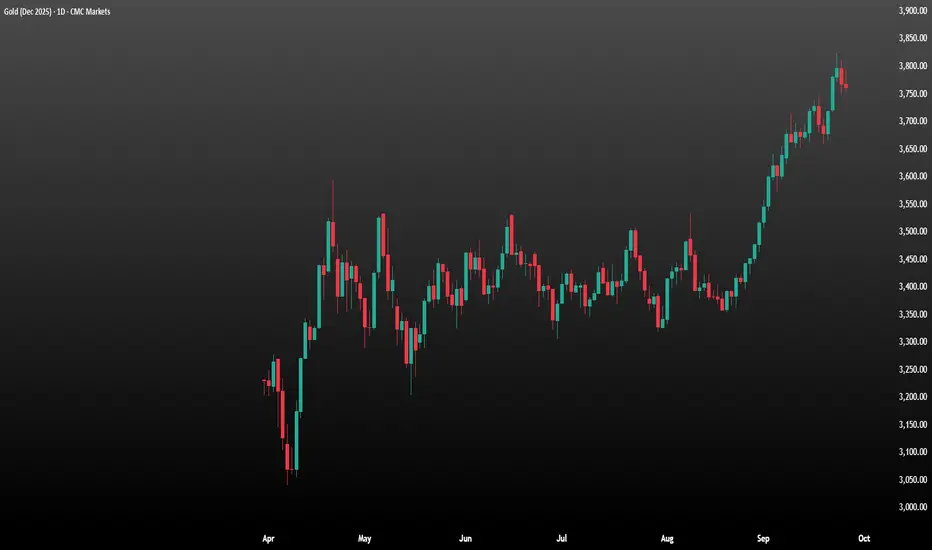
The daily chart suggests there may be a little further for gold to rally, but not much, with $3,820 marking the upper end of the trading range. With the RSI currently at 78, sustaining such a rally will be challenging.
While there is precedent for gold to rally further from similarly overbought levels, as seen in the early and mid-1970s, today’s inflation picture is not quite the same. Historically, gold has tended to follow boom-and-bust cycles on a recurring basis over the past 50 years, and there is a good chance that this current move higher will end in a similar fashion.

Written by Michael J. Kramer, founder of Mott Capital Management.
Disclaimer: CMC Markets is an execution-only service provider. The material (whether or not it states any opinions) is for general information purposes only and does not take into account your personal circumstances or objectives. Nothing in this material is (or should be considered to be) financial, investment or other advice on which reliance should be placed.
No opinion given in the material constitutes a recommendation by CMC Markets or the author that any particular investment, security, transaction, or investment strategy is suitable for any specific person. The material has not been prepared in accordance with legal requirements designed to promote the independence of investment research. Although we are not specifically prevented from dealing before providing this material, we do not seek to take advantage of the material prior to its dissemination.
The RSI on gold is now well above 70 on the daily, weekly, and monthly charts. It is not merely that gold’s RSI is above 70 – it has reached a staggering 89.6 on the monthly chart, a level not seen since January 1980, when it peaked at 91.2 and closed that month at $681.50. It then took more than 27 years for gold to register a new monthly closing high in September 2007.
Currently, the weekly chart exhibits similarly overbought conditions, with an RSI reading of 76, while trading above its upper Bollinger band for what appears to be four consecutive weeks. In addition, the %b – which measures how far above the upper Bollinger band the price of gold is – stands at 1.12, indicating that it is historically quite stretched.
The daily chart suggests there may be a little further for gold to rally, but not much, with $3,820 marking the upper end of the trading range. With the RSI currently at 78, sustaining such a rally will be challenging.
While there is precedent for gold to rally further from similarly overbought levels, as seen in the early and mid-1970s, today’s inflation picture is not quite the same. Historically, gold has tended to follow boom-and-bust cycles on a recurring basis over the past 50 years, and there is a good chance that this current move higher will end in a similar fashion.
Written by Michael J. Kramer, founder of Mott Capital Management.
Disclaimer: CMC Markets is an execution-only service provider. The material (whether or not it states any opinions) is for general information purposes only and does not take into account your personal circumstances or objectives. Nothing in this material is (or should be considered to be) financial, investment or other advice on which reliance should be placed.
No opinion given in the material constitutes a recommendation by CMC Markets or the author that any particular investment, security, transaction, or investment strategy is suitable for any specific person. The material has not been prepared in accordance with legal requirements designed to promote the independence of investment research. Although we are not specifically prevented from dealing before providing this material, we do not seek to take advantage of the material prior to its dissemination.
כתב ויתור
המידע והפרסומים אינם אמורים להיות, ואינם מהווים, עצות פיננסיות, השקעות, מסחר או סוגים אחרים של עצות או המלצות שסופקו או מאושרים על ידי TradingView. קרא עוד בתנאים וההגבלות.
כתב ויתור
המידע והפרסומים אינם אמורים להיות, ואינם מהווים, עצות פיננסיות, השקעות, מסחר או סוגים אחרים של עצות או המלצות שסופקו או מאושרים על ידי TradingView. קרא עוד בתנאים וההגבלות.