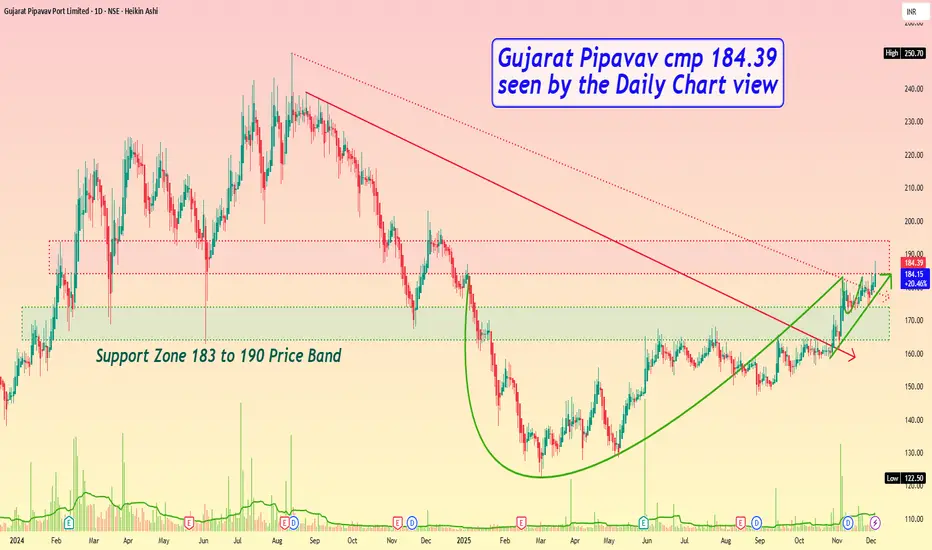
Gujarat Pipavav cmp 184.39 by Daily Chart view
- Support Zone 164 to 174 Price Band
- Resistance Zone 184 to 194 Price Band
- Bullish Cup & Handle formed by Resistance Zone neckline
- Breakout from both Falling Resistance Trendline well sustained
- Volumes spiking heavily to well above and in sync with avg traded qty
- Positively trending Technical Indicators BB, EMA, MACD, RSI, SAR, SuperTrend
כתב ויתור
המידע והפרסומים אינם מיועדים להיות, ואינם מהווים, ייעוץ או המלצה פיננסית, השקעתית, מסחרית או מכל סוג אחר המסופקת או מאושרת על ידי TradingView. קרא עוד ב־תנאי השימוש.
כתב ויתור
המידע והפרסומים אינם מיועדים להיות, ואינם מהווים, ייעוץ או המלצה פיננסית, השקעתית, מסחרית או מכל סוג אחר המסופקת או מאושרת על ידי TradingView. קרא עוד ב־תנאי השימוש.