Analysis of the Chart for Graphite India Ltd (NSE)
Key Observations:
Elliott Wave Count:
The chart follows an Elliott Wave pattern.
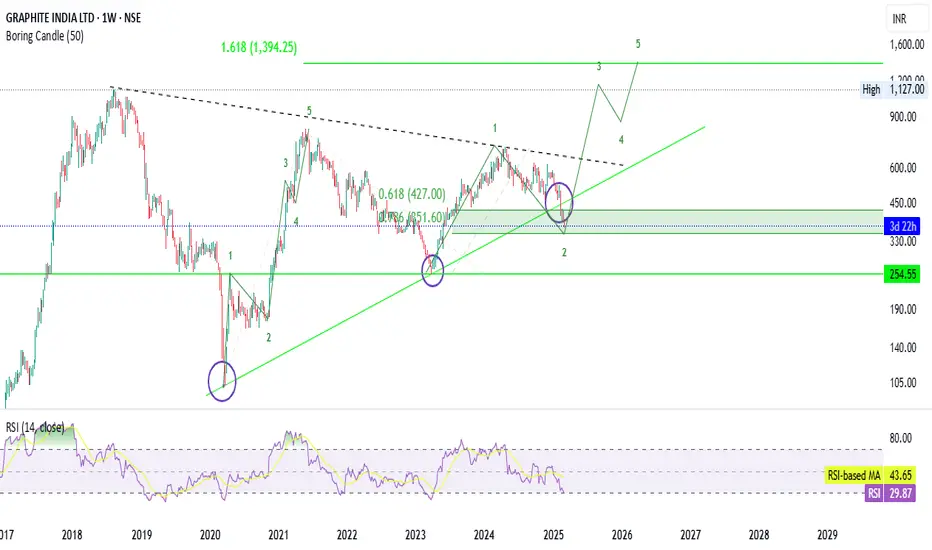
It shows a Wave 1 and Wave 2 completion and a potential Wave 3 initiation.
The projection suggests a strong upward movement for Wave 3, followed by corrective Wave 4 and final Wave 5.
Support and Resistance Levels:
Support Zones: Around ₹254.55 and ₹330.00.
Resistance Levels: Fibonacci projections indicate key resistance near ₹427.00, ₹1,127.00, and ₹1,394.25.
Trendline & Fibonacci Levels:
The price has tested the trendline multiple times, acting as strong support.
Fibonacci retracement levels at 0.618 (₹427.00) and 0.786 (₹151.60) indicate key reaction points.
RSI (Relative Strength Index):
Current RSI = 29.87, which is in the oversold zone (<30). This suggests that the stock might be undervalued and could be due for a bounce-back.
Suggestions:
Bullish Outlook:
If price holds above ₹330 and confirms a reversal, it may trigger Wave 3 rally.
First upside target is around ₹427, followed by ₹1,127 (historical resistance) and potential ₹1,394 (Fibonacci 1.618 level).
Entry could be considered near ₹330 with a stop-loss around ₹254 for risk management.
Bearish Scenario:
If ₹330 support fails, then ₹254 becomes the last major support.
Below ₹254, a bearish breakdown can occur.
Conclusion:
Short-term traders can look for a bounce from ₹330 with a stop-loss at ₹254.
Long-term investors can consider adding positions on dips, aiming for ₹1,127–₹1,394 over the next few years.
Confirmation via volume and breakout above ₹427 is recommended before taking aggressive long positions.
Key Observations:
Elliott Wave Count:
The chart follows an Elliott Wave pattern.
It shows a Wave 1 and Wave 2 completion and a potential Wave 3 initiation.
The projection suggests a strong upward movement for Wave 3, followed by corrective Wave 4 and final Wave 5.
Support and Resistance Levels:
Support Zones: Around ₹254.55 and ₹330.00.
Resistance Levels: Fibonacci projections indicate key resistance near ₹427.00, ₹1,127.00, and ₹1,394.25.
Trendline & Fibonacci Levels:
The price has tested the trendline multiple times, acting as strong support.
Fibonacci retracement levels at 0.618 (₹427.00) and 0.786 (₹151.60) indicate key reaction points.
RSI (Relative Strength Index):
Current RSI = 29.87, which is in the oversold zone (<30). This suggests that the stock might be undervalued and could be due for a bounce-back.
Suggestions:
Bullish Outlook:
If price holds above ₹330 and confirms a reversal, it may trigger Wave 3 rally.
First upside target is around ₹427, followed by ₹1,127 (historical resistance) and potential ₹1,394 (Fibonacci 1.618 level).
Entry could be considered near ₹330 with a stop-loss around ₹254 for risk management.
Bearish Scenario:
If ₹330 support fails, then ₹254 becomes the last major support.
Below ₹254, a bearish breakdown can occur.
Conclusion:
Short-term traders can look for a bounce from ₹330 with a stop-loss at ₹254.
Long-term investors can consider adding positions on dips, aiming for ₹1,127–₹1,394 over the next few years.
Confirmation via volume and breakout above ₹427 is recommended before taking aggressive long positions.
כתב ויתור
המידע והפרסומים אינם אמורים להיות, ואינם מהווים, עצות פיננסיות, השקעות, מסחר או סוגים אחרים של עצות או המלצות שסופקו או מאושרים על ידי TradingView. קרא עוד בתנאים וההגבלות.
כתב ויתור
המידע והפרסומים אינם אמורים להיות, ואינם מהווים, עצות פיננסיות, השקעות, מסחר או סוגים אחרים של עצות או המלצות שסופקו או מאושרים על ידי TradingView. קרא עוד בתנאים וההגבלות.