A comprehensive breakdown of Hindustan Aeronautics Ltd. (HAL) based on chart + candlestick + technical + fundamental + industry-level analysis.
- Hindustan Aeronautics Ltd. (HAL) Stock Analysis
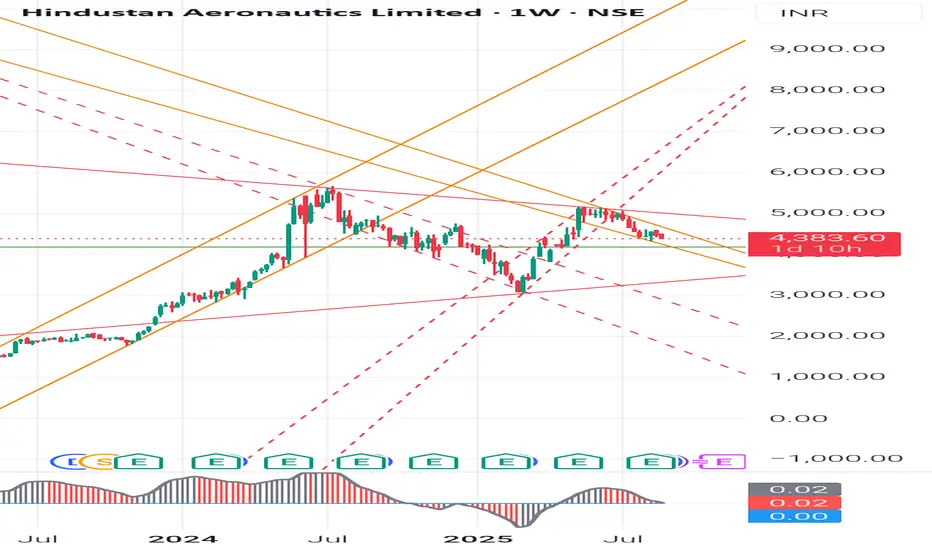
1- Candlestick Pattern Analysis (Weekly Chart)
Current Price: 4,383.6
Recent candles are showing long wicks with narrow bodies - sign of indecision between bulls and bears.
Last 4- 5 weeks - mostly lower highs and lower lows = short-term bearish bias.
No strong reversal candle yet (like hammer/bullish engulfing) - trend continuation possible unless support holds.
2- Chart Pattern Analysis
The stock is moving inside a falling channel (descending channel) from the peak of - 5,200.
This may develop into a Bullish Falling Wedge (pattern in progress).
If breakout above 4,550- 4,600 zone happens - strong rally possible.
If breakdown below 4,200 - risk of correction towards 3,800.
3- Swing Analysis
Swing High: 5,250
Swing Low: 3,400 (recent bottom in 2024)
Current swing = pullback after rejection near 4,800- 4,900 zone.
Risk-reward is favorable for long-term investors around support zones (4,200- 4,000).
4- Key Levels
Immediate Support: 4,200 - 4,000 - 3,800
Immediate Resistance: 4,550 - 4,900 - 5,250
Perfect Entry for Long (Investors): Between 4,000- 4,200 with stop loss below 3,800.
Perfect Entry for Short (Traders): Near 4,500- 4,600 zone with target 4,200.
5- Industry Analysis (Defence & Aerospace Sector)
India’s Defence sector is getting strong govt. support (Atmanirbhar Bharat, Defence production push).
HAL is a PSU monopoly in aerospace & defence manufacturing (fighter jets, helicopters, engines).
Order Book: Robust pipeline with 80,000+ crore confirmed + new export opportunities.
Primary Market: Defence PSUs (HAL, BEL, BDL, Mazagon Dock) have outperformed broader market since 2020.
Secondary Market: HAL is relatively less volatile compared to private defence companies, due to stable govt. contracts.
6- Peer Comparison (Fundamentals)
Company P/E Ratio ROE Order Book Debt-Equity EPS Growth
HAL - 33x 28% 80,000+ Cr 0.01 (Debt-Free) Strong
BEL - 41x 23% 75,000+ Cr 0.05 Good
BDL - 48x 19% 20,000+ Cr 0.03 Moderate
Mazagon Dock - 32x 26% 65,000+ Cr 0.02 High
👉 HAL has-
Stronger ROE than peers
Debt-Free balance sheet
Slightly lower P/E than BEL & BDL - fair valuation
7- Learnings for Students (Investment Perspective)
- Chart patterns matter: HAL is showing a falling wedge, which is often bullish if breakout happens.
- Fundamentals matter: A stock with strong order book, high ROE, and debt-free status is usually safer.
-Valuation check: P/E ratio must be compared with industry average before investing.
- Patience needed: Weekly charts show long-term view. Don’t panic on short-term volatility.
- Sectoral push: Govt. policy & industry growth can override short-term technical weakness.
Summary:
HAL is currently in a consolidation/correction phase, testing strong support near 4,200.
Investors: Good zone to accumulate in dips for long-term (target 5,500+ if breakout sustains).
Traders: Short-term bearish bias until weekly close above 4,550.
👉Disclaimer-
This analysis is for educational purposes only. Not a SEBI-registered advisory. Please do your own research or consult a financial advisor before investing.
#HAL #StockMarketIndia #DefenceStocks #Investing #SwingTrading #PSUStocks #StockMarketEducation #ChartAnalysis #ValueInvesting #AtmanirbharBharat
- Hindustan Aeronautics Ltd. (HAL) Stock Analysis
1- Candlestick Pattern Analysis (Weekly Chart)
Current Price: 4,383.6
Recent candles are showing long wicks with narrow bodies - sign of indecision between bulls and bears.
Last 4- 5 weeks - mostly lower highs and lower lows = short-term bearish bias.
No strong reversal candle yet (like hammer/bullish engulfing) - trend continuation possible unless support holds.
2- Chart Pattern Analysis
The stock is moving inside a falling channel (descending channel) from the peak of - 5,200.
This may develop into a Bullish Falling Wedge (pattern in progress).
If breakout above 4,550- 4,600 zone happens - strong rally possible.
If breakdown below 4,200 - risk of correction towards 3,800.
3- Swing Analysis
Swing High: 5,250
Swing Low: 3,400 (recent bottom in 2024)
Current swing = pullback after rejection near 4,800- 4,900 zone.
Risk-reward is favorable for long-term investors around support zones (4,200- 4,000).
4- Key Levels
Immediate Support: 4,200 - 4,000 - 3,800
Immediate Resistance: 4,550 - 4,900 - 5,250
Perfect Entry for Long (Investors): Between 4,000- 4,200 with stop loss below 3,800.
Perfect Entry for Short (Traders): Near 4,500- 4,600 zone with target 4,200.
5- Industry Analysis (Defence & Aerospace Sector)
India’s Defence sector is getting strong govt. support (Atmanirbhar Bharat, Defence production push).
HAL is a PSU monopoly in aerospace & defence manufacturing (fighter jets, helicopters, engines).
Order Book: Robust pipeline with 80,000+ crore confirmed + new export opportunities.
Primary Market: Defence PSUs (HAL, BEL, BDL, Mazagon Dock) have outperformed broader market since 2020.
Secondary Market: HAL is relatively less volatile compared to private defence companies, due to stable govt. contracts.
6- Peer Comparison (Fundamentals)
Company P/E Ratio ROE Order Book Debt-Equity EPS Growth
HAL - 33x 28% 80,000+ Cr 0.01 (Debt-Free) Strong
BEL - 41x 23% 75,000+ Cr 0.05 Good
BDL - 48x 19% 20,000+ Cr 0.03 Moderate
Mazagon Dock - 32x 26% 65,000+ Cr 0.02 High
👉 HAL has-
Stronger ROE than peers
Debt-Free balance sheet
Slightly lower P/E than BEL & BDL - fair valuation
7- Learnings for Students (Investment Perspective)
- Chart patterns matter: HAL is showing a falling wedge, which is often bullish if breakout happens.
- Fundamentals matter: A stock with strong order book, high ROE, and debt-free status is usually safer.
-Valuation check: P/E ratio must be compared with industry average before investing.
- Patience needed: Weekly charts show long-term view. Don’t panic on short-term volatility.
- Sectoral push: Govt. policy & industry growth can override short-term technical weakness.
Summary:
HAL is currently in a consolidation/correction phase, testing strong support near 4,200.
Investors: Good zone to accumulate in dips for long-term (target 5,500+ if breakout sustains).
Traders: Short-term bearish bias until weekly close above 4,550.
👉Disclaimer-
This analysis is for educational purposes only. Not a SEBI-registered advisory. Please do your own research or consult a financial advisor before investing.
#HAL #StockMarketIndia #DefenceStocks #Investing #SwingTrading #PSUStocks #StockMarketEducation #ChartAnalysis #ValueInvesting #AtmanirbharBharat
כתב ויתור
המידע והפרסומים אינם אמורים להיות, ואינם מהווים, עצות פיננסיות, השקעות, מסחר או סוגים אחרים של עצות או המלצות שסופקו או מאושרים על ידי TradingView. קרא עוד בתנאים וההגבלות.
כתב ויתור
המידע והפרסומים אינם אמורים להיות, ואינם מהווים, עצות פיננסיות, השקעות, מסחר או סוגים אחרים של עצות או המלצות שסופקו או מאושרים על ידי TradingView. קרא עוד בתנאים וההגבלות.