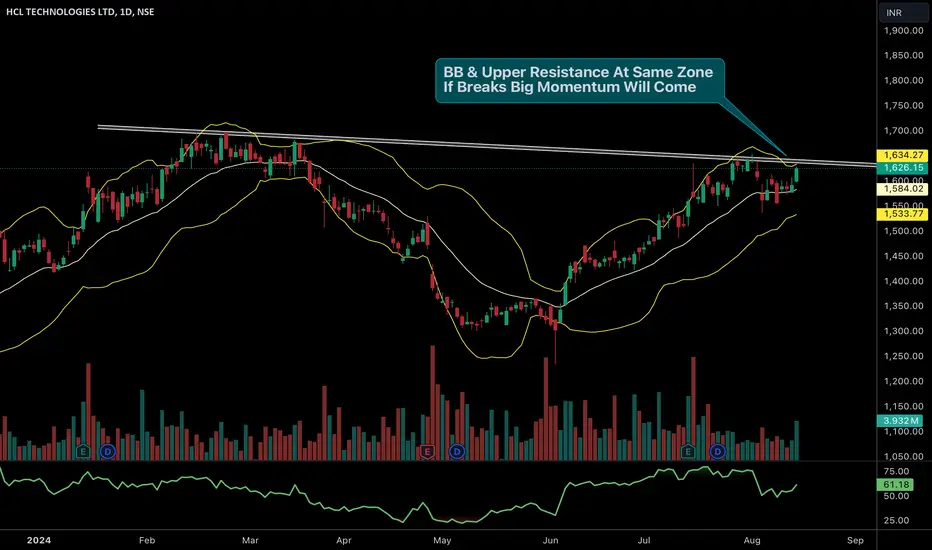
✅ HCL Tech has been consolidating near its upper resistance zone, where both the Bollinger Bands and trendline resistance align. This zone around ₹1630-1650 is crucial as a breakout above this level could trigger significant momentum.
✅ The stock is showing strength, moving along the upper Bollinger Band, which often precedes a breakout when combined with rising volumes.
✅ Watch for a breakout above the ₹1650 level. If the stock sustains above this zone, it could see a sharp upside move. However, failure to break this resistance may lead to a pullback towards the middle Bollinger Band and support around ₹1550-1600.
Join our community in telegram for real time updates --- telegram.me/marketiik
Telegram- telegram.me/marketiik
A simple trader, distancing from the fake crowd. Simplifying complexity, I prioritize genuine insights over trends.
Telegram- telegram.me/marketiik
A simple trader, distancing from the fake crowd. Simplifying complexity, I prioritize genuine insights over trends.
כתב ויתור
המידע והפרסומים אינם מיועדים להיות, ואינם מהווים, ייעוץ או המלצה פיננסית, השקעתית, מסחרית או מכל סוג אחר המסופקת או מאושרת על ידי TradingView. קרא עוד ב־תנאי השימוש.